


AUD/USD (AUDUSD) is down 0.53% on Sep 14: The Reason Has Emerged
AUD/USD (AUDUSD) is down 0.53% at Sep 14 04:20(ET), now at $0.71312, with a 7-day down of 1.18%.
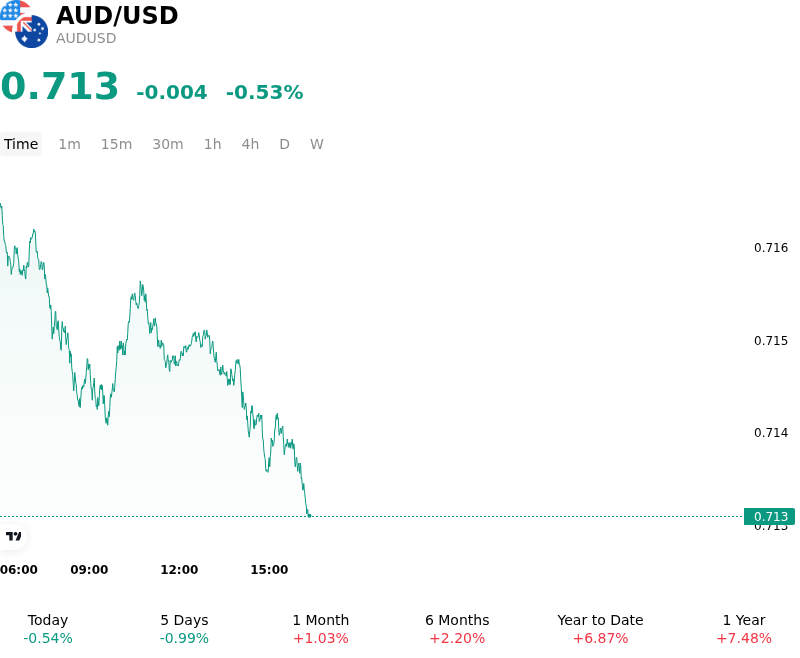
What is driving AUD/USD (AUDUSD)’s stock price down today?
The downward pressure on AUD/USD was primarily driven by widespread US dollar strength, anchored by firming market expectations of a hawkish policy stance from the Federal Reserve. Resilient economic data out of the United States, including stickier-than-expected inflation metrics and solid labor market indicators, spurred a re-pricing of the Fed's short-term interest-rate path. As a result, US Treasury yields surged across the curve, with short-term yields advancing alongside the benchmark 10-year yield hovering near multi-month highs. The widening yield differential between US and Australian debt instruments provided firm support to the greenback, prompting institutional flows out of the Australian dollar and into higher-yielding US dollar assets.
In addition to interest-rate differentials, global risk appetite faced headwinds from geopolitical uncertainty and broader growth caution, creating a restrictive environment for high-beta and growth-sensitive currencies. While Australian economic fundamentals continue to display sticky underlying core inflation—maintaining market pricing for a potential Reserve Bank of Australia policy tightening—the immediate hawkish repricing of the Federal Reserve completely eclipsed domestic policy dynamics. Furthermore, softness in key commodity markets and cautious positioning ahead of major central bank policy decisions further reduced investor appetite for risk assets, reinforcing the Aussie dollar's lower trajectory.
From a macro perspective, the move reflects a tactical repricing of relative monetary policy paths rather than a structural deterioration in Australia's economic outlook. However, near-term risks for AUD/USD remain tilted to the downside as long as elevated US bond yields and strong US dollar momentum persist. Market participants will continue to scrutinize upcoming global inflation prints, central bank policy announcements, and commodity price trends to assess whether the US dollar's yield advantage can be sustained over the medium term.
Technical Analysis of AUD/USD (AUDUSD)
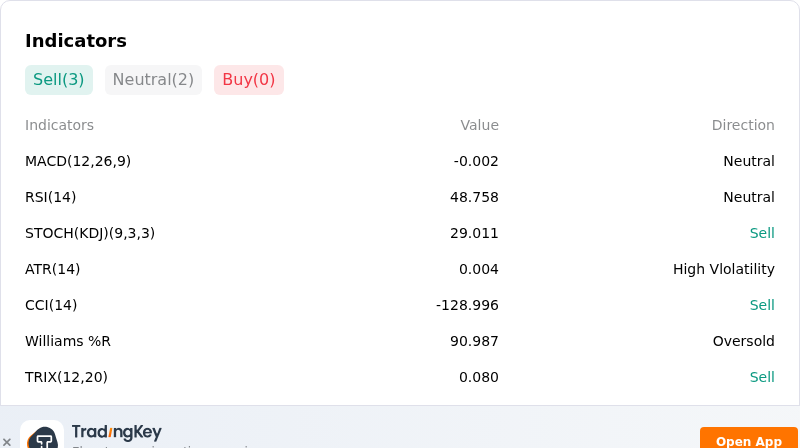
Technically, AUD/USD (AUDUSD) shows a MACD (12,26,9) value of -0.002, indicating a neutral signal. The RSI at 48.758 suggests neutral condition and the Williams %R at 90.987 suggests oversold condition. Please monitor closely.
More details about AUD/USD (AUDUSD)
Recent Events and Risks:
- Hawkish Fed Repricing & US Yield Spikes: Stronger-than-expected US inflation data has reinforced expectations of a Federal Reserve rate hike, pushing US Treasury yields higher and widening short-term yield differentials in favor of the US dollar against Australian debt.
- Deteriorating Australian Economic Sentiment: Australian business conditions slipped into negative territory alongside a sharp drop in consumer confidence, driven by rising unemployment fears and tight financial conditions that threaten to cap Reserve Bank of Australia policy support.
- Chinese Growth Momentum Loss & Commodity Exposure: Weak retail sales, industrial production, and fixed-asset investment data out of China signal persistent economic headwinds in Australia’s primary export partner, dampening demand expectations for iron ore and base metals.
- Geopolitical Hostilities & Risk-Off Sentiment: Heightened geopolitical tensions in the Middle East and surging energy prices have sparked a global risk-averse impulse, triggering long liquidation in high-beta currencies like AUD in favor of safe-haven greenback liquidity.
Recommended Articles


