


EUR/USD (EURUSD) Drops 0.53% on Sep 14: What Does the Market Value?
EUR/USD (EURUSD) is down 0.53% at Sep 14 04:15(ET), now at $1.15355, with a 7-day down of 0.74%.
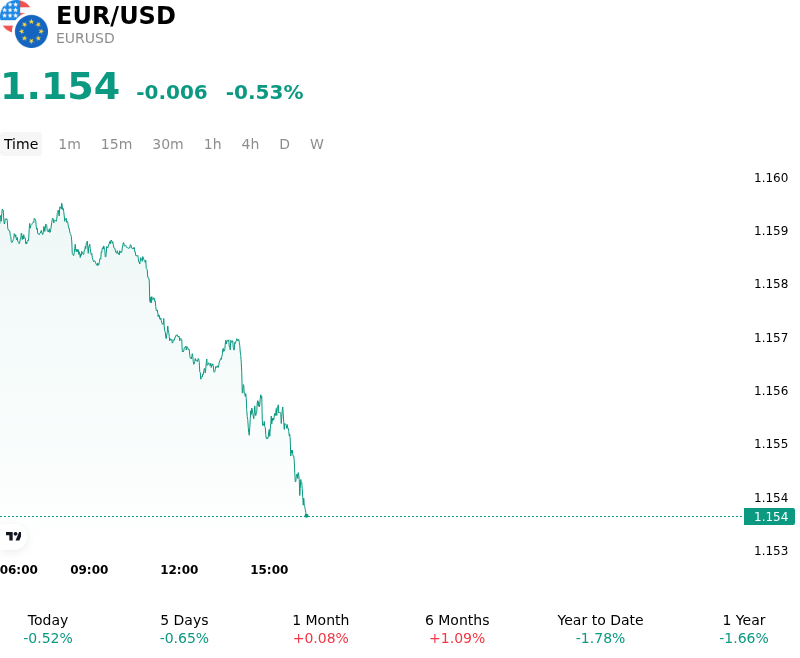
What is driving EUR/USD (EURUSD)’s stock price down today?
The downward pressure on EURUSD reflects a widening yield differential between the United States and the Eurozone, driven primarily by aggressive market repricing ahead of the Federal Reserve's upcoming monetary policy decision. Solid U.S. employment data and persistent monthly core inflation readings have reinforced hawkish messaging from Fed officials. Consequently, money markets have priced in a high probability of a Federal Reserve rate hike, driving U.S. Treasury yields higher across the curve and expanding the U.S. dollar's short-term yield advantage over euro-denominated fixed income assets.
While the European Central Bank recently delivered a 25 basis point interest rate increase to combat energy-driven inflation, the Euro failed to derive sustained support. Foreign exchange markets view the ECB's tightening path as increasingly constrained by fragile Eurozone growth fundamentals. Elevated crude oil and natural gas prices stemming from Middle East geopolitical tensions impose a heavier terms-of-trade tax on the energy-importing European economy compared to the United States. As a result, market participants perceive a tighter limit on how much further the ECB can hike without triggering broader macroeconomic stagnation.
Global risk sentiment and capital flow dynamics have further bolstered the Greenback. Higher energy costs and geopolitical uncertainties have softened broader market risk appetite, prompting institutional investors to favor liquid, safe-haven U.S. assets. From a technical standpoint, the currency pair's fall below key support levels around the 1.1600 mark accelerated selling pressure, triggering automated stop-loss execution and reinforcing short-term downward momentum.
In the near term, the relative trajectory of monetary policy remains the central catalyst for EURUSD. Unless upcoming U.S. economic data unexpectedly softens or the Federal Reserve adopts a more cautious forward guidance, the pair is likely to remain capped by firm U.S. yields and lingering growth headwinds in the euro area.
Technical Analysis of EUR/USD (EURUSD)
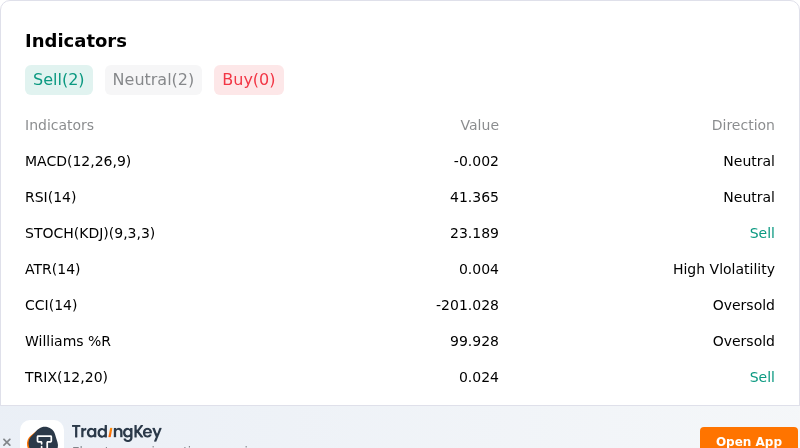
Technically, EUR/USD (EURUSD) shows a MACD (12,26,9) value of -0.002, indicating a neutral signal. The RSI at 41.365 suggests neutral condition and the Williams %R at 99.928 suggests oversold condition. Please monitor closely.
More details about EUR/USD (EURUSD)
Recent Events and Risks:
- Hawkish Fed Re-pricing Post-U.S. CPI: Firmer U.S. core CPI inflation data released over the past 48 hours pushed market expectations for a Federal Reserve rate hike at the upcoming September FOMC meeting above 85%, driving U.S. Dollar yield support and placing immediate downside pressure on EUR/USD.
- ECB Rate Hike "Sell-the-Fact" Unwind: Following the European Central Bank's 25 basis point rate increase to 2.50% on September 10, the euro failed to secure bullish traction as the decision was fully discounted, leaving rate differentials unsupportive as markets price in a potential pause in future ECB tightening.
- Terms-of-Trade Drag from Energy Price Surge: Elevated European natural gas benchmarks and Brent crude trading above $100 per barrel amid ongoing Middle East conflict escalate energy import costs for the Eurozone, triggering current account deterioration that directly pressures the euro.
- Technical Support Vulnerability Below 1.1585: EUR/USD price action has tested key support near 1.1591, with institutional FX analysts highlighting that a confirmed daily close under 1.1585–1.1565 risks accelerating downside momentum toward 1.1500 through stop-loss executions.
Recommended Articles


