


NZD/USD (NZDUSD) Is down 0.50% on Sep 14: Are Market Expectations Adjusting?
NZD/USD (NZDUSD) is down 0.50% at Sep 14 01:25(ET), now at $0.57811, with a 7-day down of 1.60%.
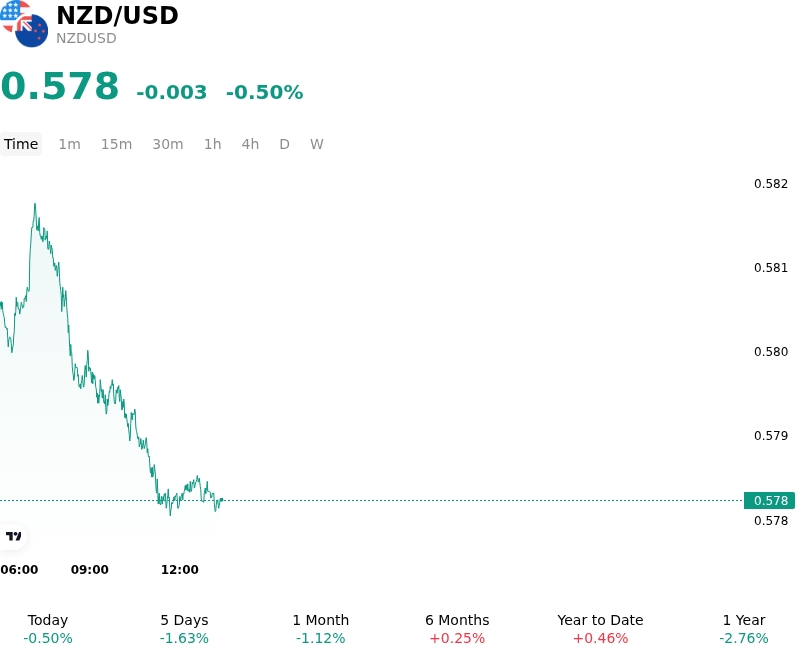
What is driving NZD/USD (NZDUSD)’s stock price down today?
The decline in the New Zealand dollar against the greenback reflects a widening divergence in monetary policy expectations and interest-rate differentials. Although the Reserve Bank of New Zealand recently raised its Official Cash Rate, the accompanying forward guidance struck an unexpectedly cautious tone. RBNZ policymakers framed the rate increase as a gradual removal of monetary stimulus rather than the start of an aggressive tightening cycle, signaling a potential pause at upcoming meetings. This dovish messaging led investors to reprice the path for New Zealand short-term yields lower, eroding interest-rate support for the Kiwi dollar.
In contrast, the US dollar gathered broad-based support as market participants positioned for the upcoming Federal Reserve policy meeting. Persistent upside risks to inflation and resilient US economic activity have kept Treasury yields elevated across the curve, reinforcing expectations that the Federal Reserve will maintain a restrictive policy stance. Higher US bond yields continue to widen short-term interest-rate differentials in favor of the US dollar, attracting yield-seeking capital flows away from high-beta antipodean currencies.
Compounding the pressure on the base currency are persistent growth headwinds in China, New Zealand's primary export destination. Softer-than-expected Chinese import demand and subdued domestic consumption have signaled sluggish trade activity, directly impacting commodity export outlooks and demand for the Kiwi. In addition, broader market risk sentiment remains cautious amid elevated energy prices and geopolitical friction, favoring liquidity and safe-haven demand for the greenback over pro-cyclical commodity currencies.
From a structural standpoint, the downward movement was further amplified by technical selling as the pair broke below key psychological support levels near the 0.5800 handle and remained capped beneath medium-term moving averages. The combination of dovish RBNZ forward guidance, persistent Chinese demand headwinds, and firm US rate expectations suggests that the retreat in NZDUSD is anchored in macro fundamentals rather than mere temporary positioning adjustments. Key risks for investors to monitor include upcoming US central bank policy messaging and further economic developments in key Asian trading partners.
Technical Analysis of NZD/USD (NZDUSD)
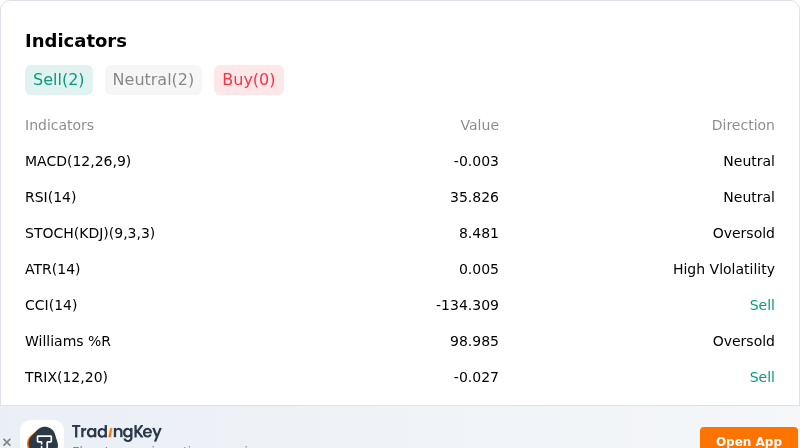
Technically, NZD/USD (NZDUSD) shows a MACD (12,26,9) value of -0.003, indicating a neutral signal. The RSI at 35.826 suggests neutral condition and the Williams %R at 98.985 suggests oversold condition. Please monitor closely.
More details about NZD/USD (NZDUSD)
Recent Events and Risks:
- RBNZ Policy Guidance and Dovish Repricing: Following the Reserve Bank of New Zealand's recent rate hike to 2.75%, official guidance emphasizing a gradual pace of stimulus removal and a potential policy pause confirmed a dovish shift relative to hawkish market pricing. The failure to validate aggressive tightening expectations has spurred an unwinding of short-term rate expectations, keeping the Kiwi dollar under selling pressure.
- Pre-Fed Hawkish Re-Pricing and Yield Spread Pressure: Resilient US labor figures and sticky inflation data have boosted US Treasury yields and raised expectations for a hawkish Federal Reserve policy stance at its upcoming decision. The resulting widening of yield differentials in favor of the Greenback exerts persistent downward pressure on the NZD/USD pair.
- China Economic Softness and Export Headwinds: Disappointing trade data from China, highlighted by weaker-than-expected import growth, points to lingering domestic demand softness in New Zealand's chief export destination. Slowing Chinese industrial activity and property sector headwinds directly threaten New Zealand dairy and forestry export revenues, weighing on the currency's commodity sentiment.
- Technical Support Breakdown Below 0.5800: Intraday price action broke below the critical 0.5800 psychological threshold, moving beneath a dense moving average cluster and technical trendlines. Negative divergence across short-term momentum indicators like the RSI risks triggering automated stop-loss liquidations, opening downside vulnerability toward the mid-0.57 levels.
Recommended Articles


