
Cardano Price Forecast: Hovers near key EMAs as cautious metrics leave rallies exposed to selling

Source Fxstreet
  • Cardano hovers near the key 50-day and 100-day EMAs around $0.200 on Monday after losses of over 8% in the previous week.
  • Mixed derivatives metrics continue to cap ADA.
  • The technical outlook suggests that bullish attempts remain vulnerable to selling pressure at higher levels.

Cardano (ADA) hovers around the key support zone of $0.200 on Monday after falling more than 8% in the previous week. Mixed derivatives metrics continue to limit bullish momentum, while the technical outlook suggests that recovery attempts remain vulnerable to selling pressure at higher levels for ADA.

Mixed derivatives metrics cap Cardano

Cardano’s derivatives data shows a cautious outlook. CoinGlass’ long-to-short ratio for ADA reads 0.88 on Monday, nearing its lowest level in a month. A ratio below one indicates bearish sentiment, as traders bet that asset prices will fall.
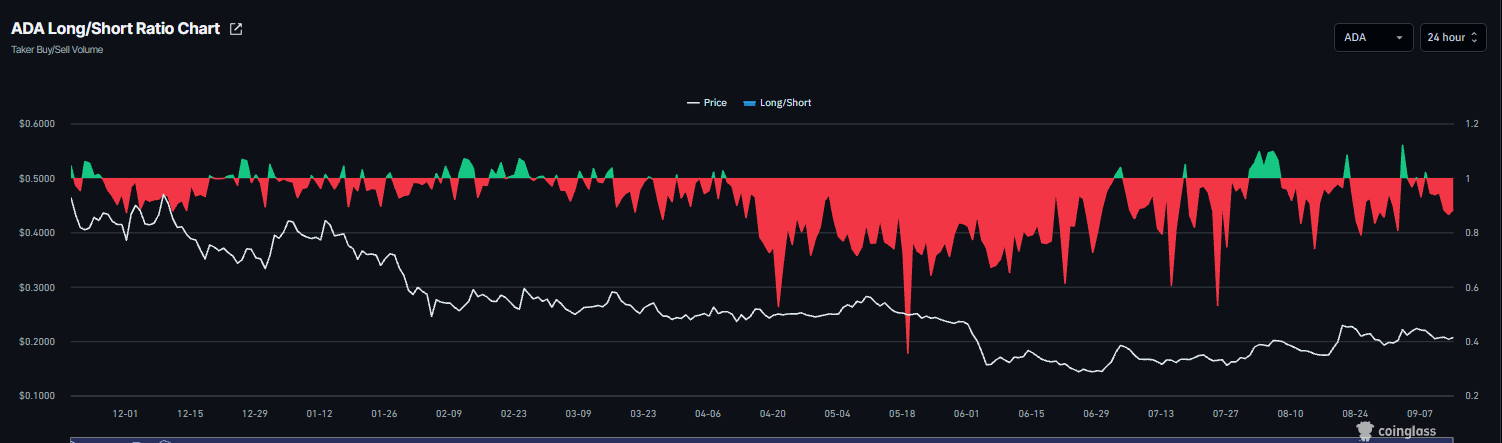
Cardano long-to-short ratio chart. Source: Coinglass

However, Cardano’s funding rate flipped positive on Monday, reading 0.0052%. This positive rate indicates longs are paying shorts and reflects a mild bullish bias among traders.
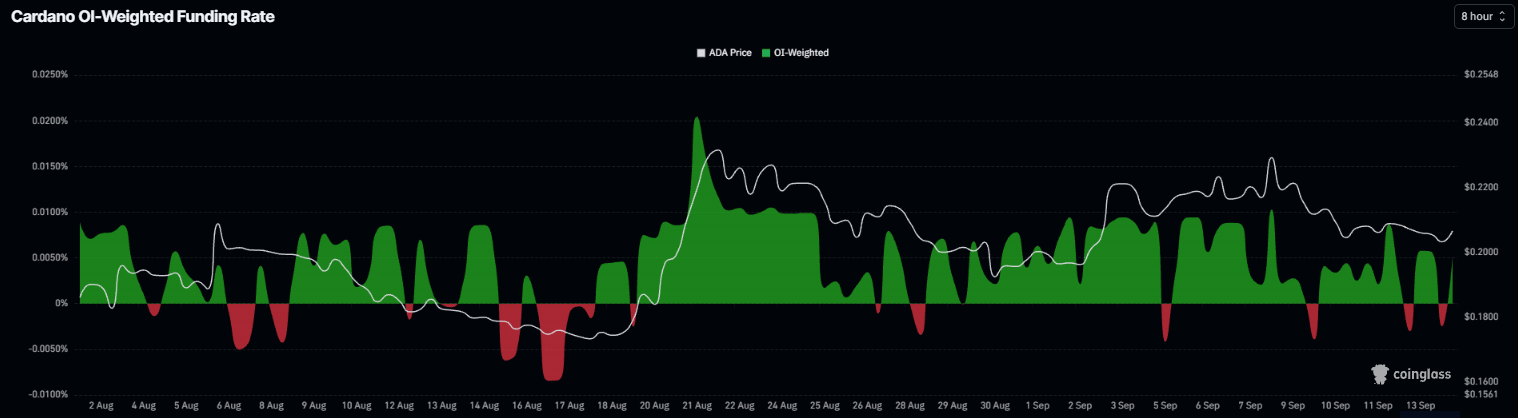
Cardano funding rates chart. Source: Coinglass

On-chain data signals cautious outlook

CryptoQuant’s summary data shows cautious signs for Cardano. ADA’s futures markets show large whale orders, but with sell-side dominance. Moreover, both spot and futures markets show heating conditions while other metrics remain neutral, highlighting a bearish, cautious sentiment bias among Cardano traders.
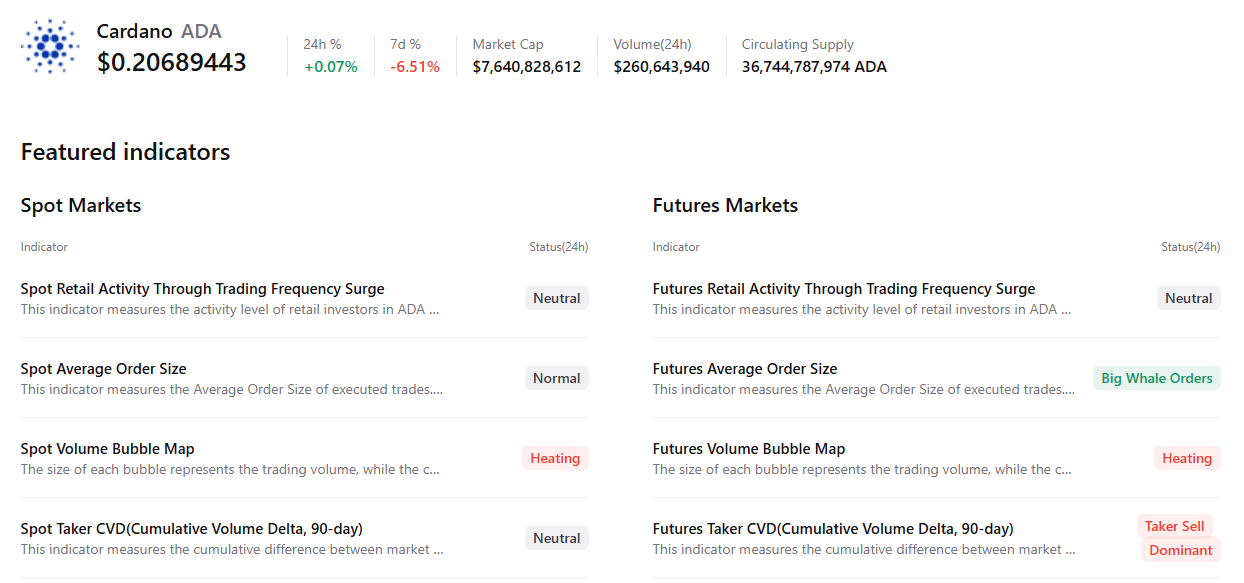
Cardano summary chart. Source: CryptoQuant

Cardano technical outlook: Recovery attempts remain vulnerable

Cardano price trades at $0.207 on Monday, holding above the 50-day and 100-day exponential moving averages (EMAs) at $0.199 and $0.200, which lends the pair a mildly constructive tone despite the broader downtrend.

ADA is now sandwiched between these reclaimed short-term supports and a dense overhead layer led by the 50% retracement at $0.213 and the 61.8% Fibonacci retracement level at $0.231, while the 200-day EMA at $0.240 and horizontal caps at $0.236 and $0.245 reinforce a medium-term ceiling.

The Relative Strength Index (RSI) at 50 is essentially neutral, hinting at consolidation rather than strong directional pressure, and the Moving Average Convergence Divergence (MACD) indicator remains slightly negative, suggesting that bullish attempts are still vulnerable to selling at higher levels.

On the downside, immediate support is aligned at the 100-day and 50-day EMAs just above $0.200, followed by the 38.2% Fibonacci retracement at $0.195, which marks the first deeper pullback area before the next structural floors at $0.173 and $0.150.

On the topside, initial resistance emerges at the 50% retracement at $0.213, ahead of the 61.8% Fibonacci retracement level at $0.231 and the horizontal barrier at $0.236; a sustained break of this cluster would expose the 200-day EMA near $0.240 and the $0.245 cap, with a more ambitious objective only coming into view toward the distant horizontal barrier at $0.299.
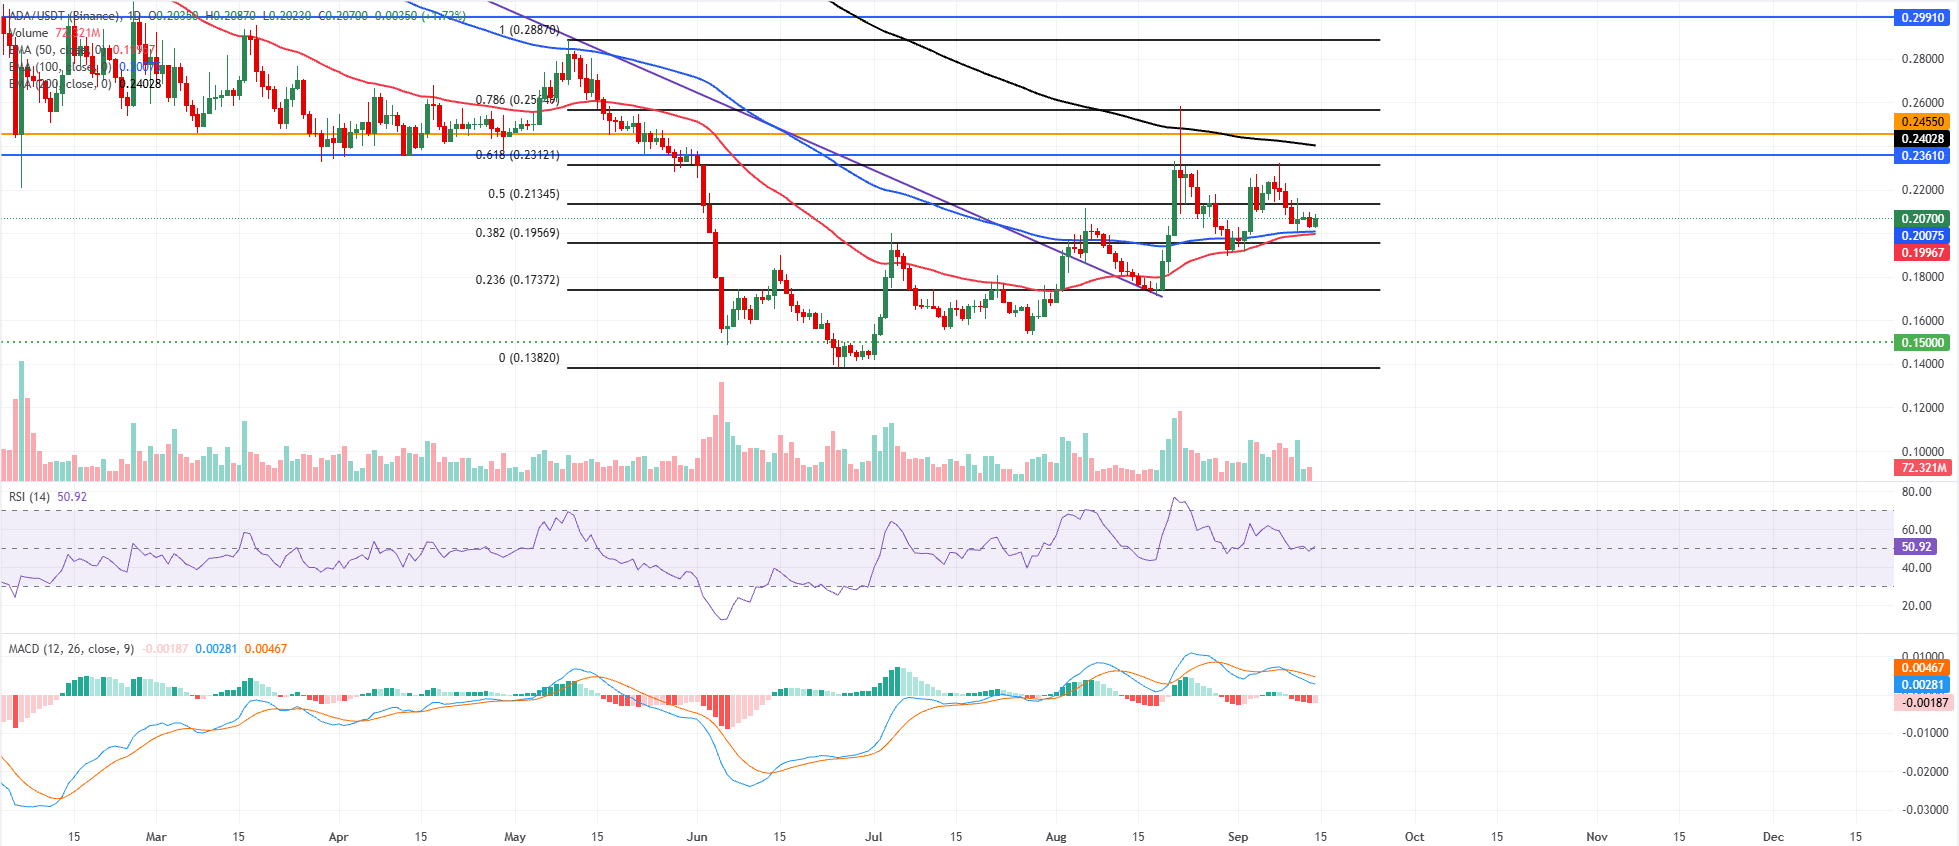
ADA/USDT daily chart

(The technical analysis of this story was written with the help of an AI tool. Know more.)

Disclaimer: For information purposes only. Past performance is not indicative of future results.
placeholder
Japanese Yen rallies to February 18 high as upbeat wage data and GDP lift BoJ hike betsThe USD/JPY pair declines for the second straight day – also marking the fourth day of a fall in the previous five – and sinks to its lowest level since February 18, around mid-153.00s during the Asian session on Tuesday.
Author  FXStreet
Sep 08, Tue
The USD/JPY pair declines for the second straight day – also marking the fourth day of a fall in the previous five – and sinks to its lowest level since February 18, around mid-153.00s during the Asian session on Tuesday.
placeholder
Brent holds above $100 as tanker attacks tighten supply — but four forces are capping the rallyBrent crude is holding above $100 a barrel for a second session, its first close above the level since late July, as tanker attacks near the Strait of Hormuz squeeze an already tight physical market. Yet the rally has been gradual: 8.3 mb/d of Gulf output is still shut in, diesel is at a record, and forecasts now range from $74 to $100.
Author  Irene Q.
Sep 10, Thu
Brent crude is holding above $100 a barrel for a second session, its first close above the level since late July, as tanker attacks near the Strait of Hormuz squeeze an already tight physical market. Yet the rally has been gradual: 8.3 mb/d of Gulf output is still shut in, diesel is at a record, and forecasts now range from $74 to $100.
placeholder
US-Iran Conflict Drives Oil Surge as WTI Tops $100 and Brent Nears $110International oil prices continued to advance rapidly this week. On Thursday Eastern Time, WTI crude (USOIL) broke through the $100/barrel mark, closing at $103.94, up 7.51%; Brent crude
Author  TradingKey
Sep 11, Fri
International oil prices continued to advance rapidly this week. On Thursday Eastern Time, WTI crude (USOIL) broke through the $100/barrel mark, closing at $103.94, up 7.51%; Brent crude
placeholder
US August CPI lands tonight: after a 5.4% PPI shock, will the Fed hike on September 16?US August PPI came in at 5.4% year-on-year, above the 5.3% consensus, with core PPI at 4.6%. Traders have pushed the odds of a 25bp Fed hike on September 15-16 to around 70%. Tonight's CPI is the last major inflation print before the decision — here is the full calendar, the consensus numbers, and what a hot versus cool reading would mean for the dollar, yields, gold and stocks.
Author  Irene Q.
Sep 11, Fri
US August PPI came in at 5.4% year-on-year, above the 5.3% consensus, with core PPI at 4.6%. Traders have pushed the odds of a 25bp Fed hike on September 15-16 to around 70%. Tonight's CPI is the last major inflation print before the decision — here is the full calendar, the consensus numbers, and what a hot versus cool reading would mean for the dollar, yields, gold and stocks.
placeholder
Gold Price Forecast: PPI and Oil Prices Fuel Inflation Concerns, Can CPI Change Gold's Direction?As of the Asian session on September 11, gold prices (XAUUSD) remained in weak consolidation today after dropping sharply to near $4,300 on Thursday, with the latest price trading around
Author  TradingKey
Sep 11, Fri
As of the Asian session on September 11, gold prices (XAUUSD) remained in weak consolidation today after dropping sharply to near $4,300 on Thursday, with the latest price trading around
Related Instrument
goTop
quote