


WTI (USOIL) Is up 2.23% on Sep 14: Is the Market Repricing It?
WTI (USOIL) is up 2.23% at Sep 14 20:05(ET), now at $100.553, with a 7-day up of 9.54%.
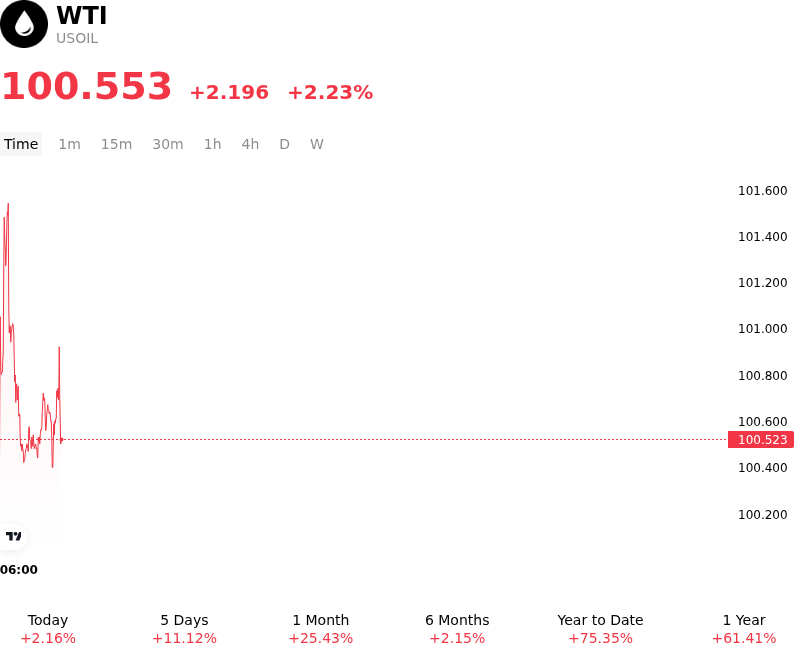
What is driving WTI (USOIL)’s stock price up today?
West Texas Intermediate crude oil pushed higher as geopolitical friction in the Middle East continues to inject a substantial supply-risk premium into physical energy markets. Escalating regional military tensions and recurring threats to maritime chokepoints, particularly near the Strait of Hormuz and the Red Sea, have reinforced fears of persistent export bottlenecks and output shut-ins among major Middle Eastern producers. Market participants are increasingly pricing in prolonged delivery disruptions rather than short-lived operational blips, as heightened security risks in critical shipping lanes constrain tanker traffic and force crude flows to take longer, more costly alternative routes.
The supply-side tightness is compounded by a rapidly depleting global inventory backdrop. Recent monthly energy reports confirm substantial cumulative draws in global petroleum stockpiles throughout the year, while downstream product markets—most notably middle distillates—are experiencing acute structural tightness. Robust physical crude buying from refiners in Asia and Europe attempting to secure non-Gulf prompt barrels has tightened available Atlantic Basin supply. Consequently, the futures curve remains anchored in deep backwardation, reinforcing the view among institutional investors that immediate physical supply constraints outweigh medium-term demand risks.
From a macroeconomic perspective, market expectations around upcoming central bank interest rate cuts have provided a supportive baseline for broader risk sentiment and global energy demand. Systematic capital flows and technical momentum also amplified the advance, as price action clearing key moving average resistance triggered algorithmic buying and speculative position-building. Moving forward, energy investors continue to monitor the persistence of Middle East maritime disruptions, weekly inventory draw rates, and potential demand destruction resulting from elevated refined product prices.
Technical Analysis of WTI (USOIL)
Technically, WTI (USOIL) shows a MACD (12,26,9) value of 2.662, indicating a buy signal. The RSI at 69.466 suggests neutral condition and the Williams %R at 8.424 suggests overbought condition. Please monitor closely.
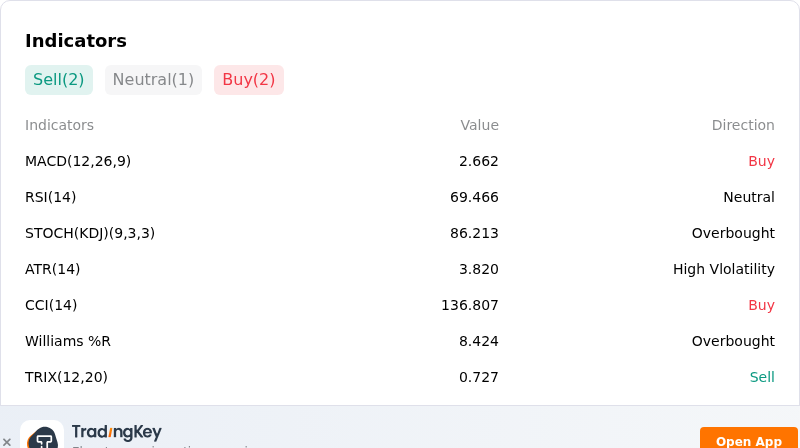
More details about WTI (USOIL)
Recent Events and Risks:
- IEA Severe Demand Destruction Outlook: The International Energy Agency warned in its latest market report that elevated fuel prices and trade bottlenecks are causing the steepest decline in global oil demand growth since the COVID-19 pandemic, cutting annual consumption forecasts across OECD and Asian markets.
- OPEC Consecutive Demand Growth Revisions: OPEC slashed its 2026 global oil demand growth forecast for the fifth consecutive month to 380,000 barrels per day, signaling widespread institutional concern over macroeconomic stagnation and weakening industrial energy usage.
- Bearish US Inventory Builds and Record Production: Recent EIA inventory data revealed smaller-than-expected crude draws alongside unexpected weekly builds in US gasoline (+1.27 million barrels) and distillate stockpiles (+2.09 million barrels), compounded by U.S. crude output rising to a record 13.95 million barrels per day.
- Speculative Position Unwinding and Profit-Taking: WTI front-month futures suffered sharp intraday downside volatility as institutional traders aggressively unwound long positions following overbought technical readings and multi-month price highs.
Recommended Articles


