
Solana (SOLUSD) Is down 1.08% on Sep 13: What Do On-Chain Data and Market Sentiment Show?

Source Tradingkey

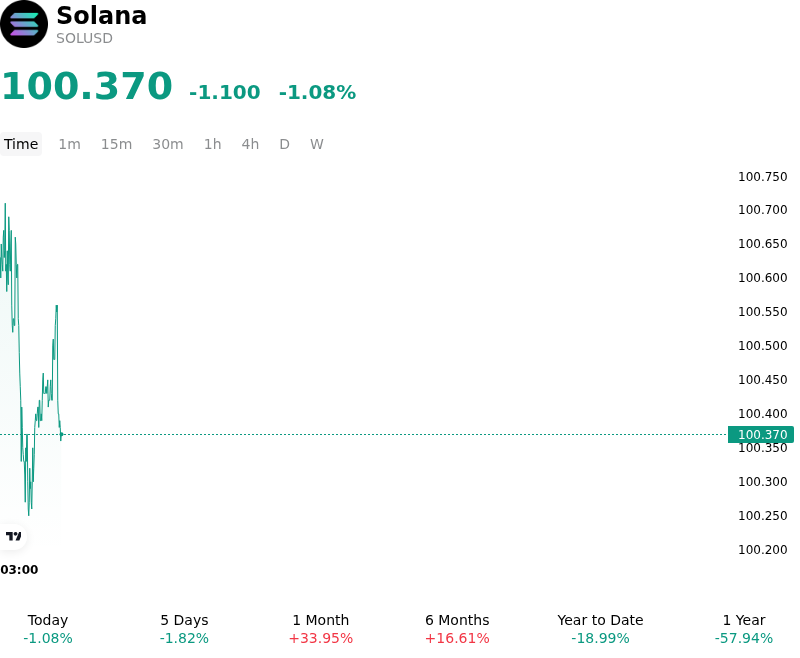
Solana (SOLUSD) is down 1.08% at Sep 13 20:05(ET), now at $100.37, with a 7-day down of 4.16%.
SummaryOverview

What is driving Solana (SOLUSD)’s stock price down today?

Solana experienced downward pressure as broader digital asset market liquidity consolidated, with capital temporarily rotating toward lower-beta assets and cash reserves. As Bitcoin dominance remained elevated across the sector, altcoin risk appetite cooled, leaving high-beta Layer-1 tokens vulnerable to localized profit-taking. This macro-driven risk aversion outweighed recent network developments, forcing derivative traders to unwind leveraged long positions after spot prices encountered firm overhead supply near key psychological resistance levels.

From a market structure perspective, fading momentum across short-term timeframes and neutral-to-bearish divergence on technical indicators prompted systematic traders to reduce directional exposure. Futures open interest contracted as long positions underwent minor liquidations following the failure to decisively clear immediate resistance bands. While institutional spot ETF inflows and custodial accumulation have established a durable medium-term floor for the token, short-term liquidity conditions were dominated by momentum-driven selling and tactical risk management by quantitative funds.

Despite the pull-back, underlying network metrics reflect sustained structural health, driven by robust decentralized exchange transaction volumes, strong validator fee generation, and anticipation surrounding institutional policy gatherings. The divergence between resilient fundamental on-chain activity and soft price action highlights a market currently dictated by broader liquidity friction rather than protocol-specific weakness. Market participants continue to monitor global monetary policy shifts, Treasury yield movements, and aggregate spot ETF net flows to assess whether the move represents temporary consolidation or a wider risk-off trend across altcoin markets.

Technical Analysis of Solana (SOLUSD)

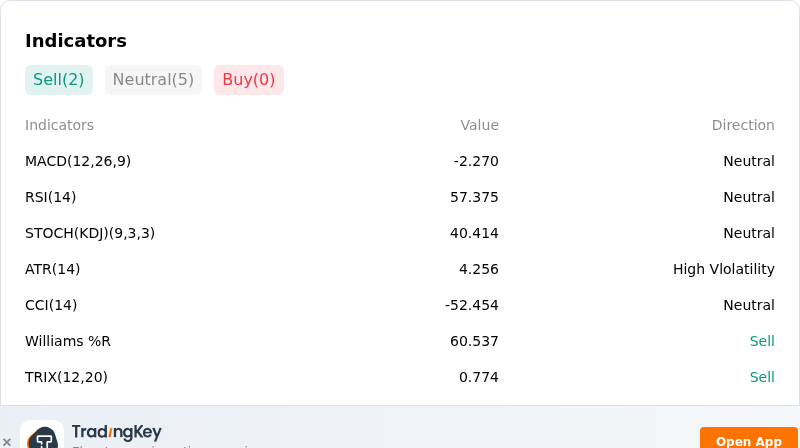
Technically, Solana (SOLUSD) shows a MACD (12,26,9) value of -2.270, indicating a neutral signal. The RSI at 57.375 suggests neutral condition and the Williams %R at 60.537 suggests sell condition. Please monitor closely.
IndicatorAnalysis

More details about Solana (SOLUSD)

Recent Events and Risks:

  • Sharp Deceleration in Spot ETF Inflows: Institutional demand via U.S. spot Solana ETFs has experienced a sharp slowdown in net creations, diminishing structural spot buying support and leaving SOL vulnerable to profit-taking and spot-driven sell-offs.
  • Derivatives Leverage and Liquidation Risk: Technical rejection below the key $100 support shelf has exposed concentrated clusters of leveraged long liquidations down to $98.00, raising the immediate threat of forced sell cascades and volatile downside extensions.
  • Macro Headwinds and High-Beta Capital Rotation: Persistent inflation metrics and elevated U.S. Treasury yields have driven broad risk-off sentiment across digital asset markets, triggering defensive capital rotation away from high-beta altcoins like Solana into Bitcoin.
  • Ecosystem Valuations and On-Chain Softening: Severe valuation pullbacks across Solana app-layer tokens—with several project tokens dropping significantly from peak levels—alongside periodic drops in active address metrics, reflect softening network participation and dampening ecosystem revenue.
Disclaimer: For information purposes only. Past performance is not indicative of future results.
placeholder
Japanese Yen rallies to February 18 high as upbeat wage data and GDP lift BoJ hike betsThe USD/JPY pair declines for the second straight day – also marking the fourth day of a fall in the previous five – and sinks to its lowest level since February 18, around mid-153.00s during the Asian session on Tuesday.
Author  FXStreet
Sep 08, Tue
The USD/JPY pair declines for the second straight day – also marking the fourth day of a fall in the previous five – and sinks to its lowest level since February 18, around mid-153.00s during the Asian session on Tuesday.
placeholder
US dollar clings to nine-week lows near 98.4 as Brent nears $100 and the yen hits a seven-month high — five events to watch todayThe dollar is pinned near nine-week lows even after a blockbuster jobs report, as an oil spike toward $100, a surging yen and China's reflation data crowd the driver's seat. Five key events to watch today: Brent at $99.46, USD/JPY at 154, China CPI/PPI, PBOC gold buying, and Thursday's PPI / Friday's CPI ahead of the September 15-16 FOMC.
Author  Eric Nkando
Sep 09, Wed
The dollar is pinned near nine-week lows even after a blockbuster jobs report, as an oil spike toward $100, a surging yen and China's reflation data crowd the driver's seat. Five key events to watch today: Brent at $99.46, USD/JPY at 154, China CPI/PPI, PBOC gold buying, and Thursday's PPI / Friday's CPI ahead of the September 15-16 FOMC.
placeholder
Brent holds above $100 as tanker attacks tighten supply — but four forces are capping the rallyBrent crude is holding above $100 a barrel for a second session, its first close above the level since late July, as tanker attacks near the Strait of Hormuz squeeze an already tight physical market. Yet the rally has been gradual: 8.3 mb/d of Gulf output is still shut in, diesel is at a record, and forecasts now range from $74 to $100.
Author  Irene Q.
Sep 10, Thu
Brent crude is holding above $100 a barrel for a second session, its first close above the level since late July, as tanker attacks near the Strait of Hormuz squeeze an already tight physical market. Yet the rally has been gradual: 8.3 mb/d of Gulf output is still shut in, diesel is at a record, and forecasts now range from $74 to $100.
placeholder
US August CPI lands tonight: after a 5.4% PPI shock, will the Fed hike on September 16?US August PPI came in at 5.4% year-on-year, above the 5.3% consensus, with core PPI at 4.6%. Traders have pushed the odds of a 25bp Fed hike on September 15-16 to around 70%. Tonight's CPI is the last major inflation print before the decision — here is the full calendar, the consensus numbers, and what a hot versus cool reading would mean for the dollar, yields, gold and stocks.
Author  Irene Q.
Sep 11, Fri
US August PPI came in at 5.4% year-on-year, above the 5.3% consensus, with core PPI at 4.6%. Traders have pushed the odds of a 25bp Fed hike on September 15-16 to around 70%. Tonight's CPI is the last major inflation print before the decision — here is the full calendar, the consensus numbers, and what a hot versus cool reading would mean for the dollar, yields, gold and stocks.
placeholder
Gold Price Forecast: PPI and Oil Prices Fuel Inflation Concerns, Can CPI Change Gold's Direction?As of the Asian session on September 11, gold prices (XAUUSD) remained in weak consolidation today after dropping sharply to near $4,300 on Thursday, with the latest price trading around
Author  TradingKey
Sep 11, Fri
As of the Asian session on September 11, gold prices (XAUUSD) remained in weak consolidation today after dropping sharply to near $4,300 on Thursday, with the latest price trading around
goTop
quote