


BNB (BNBUSD) Suddenly Goes up 1.27% on Sep 5: What's Driving This
BNB (BNBUSD) is up 1.27% at Sep 5 02:40(ET), now at $725.3, with a 7-day up of 4.99%.
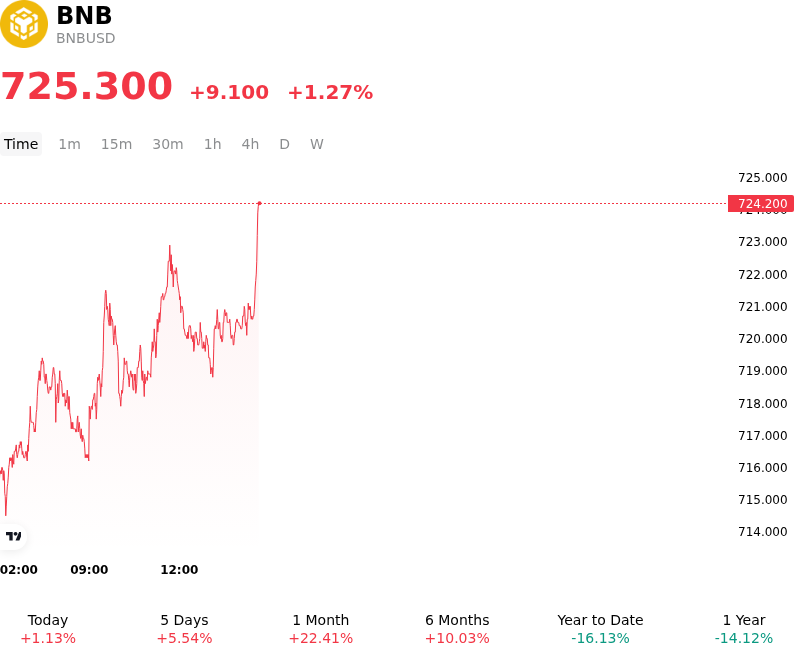
What is driving BNB (BNBUSD)’s stock price up today?
The advance in BNB reflects broader risk-on sentiment across the digital asset space, spurred by shifting macroeconomic expectations and improving global market liquidity. Dovish commentary from Federal Reserve officials softened short-term interest rate expectations and tempered Treasury yields, easing systemic rate headwinds that had previously constrained risk-asset valuations. As financial conditions loosened and the US dollar stabilized, capital flows returned to established digital assets, creating a supportive backdrop for large-cap token performance.
Capital inflows into major spot digital asset investment vehicles, alongside renewed buying across primary benchmarks, significantly improved overall market depth and spot liquidity. This constructive backdrop triggered a squeeze on leveraged short positions across cryptocurrency derivatives markets, forcing mechanical buybacks that accelerated momentum across liquid high-beta tokens. BNB benefited from this market-wide repricing as expanding derivatives liquidity and broader venue integration encouraged institutional and systematic capital rotation into leading platform-linked tokens.
Asset-specific dynamics provided additional fundamental support for the token. On-chain engagement across the BNB Chain remained firm, bolstered by ongoing ecosystem incentive programs and activity in decentralized finance and Web3 protocols. The asset's structured quarterly token burn mechanism continues to systematically constrain circulating supply, reinforcing long-term scarcity dynamics. From a technical perspective, the price recovery above key exponential moving averages attracted momentum-focused capital. While institutional investors continue to monitor macro policy developments and broader regulatory shifts, the alignment of improving market-wide liquidity and sound network tokenomics underpins the token's current strength.
Technical Analysis of BNB (BNBUSD)
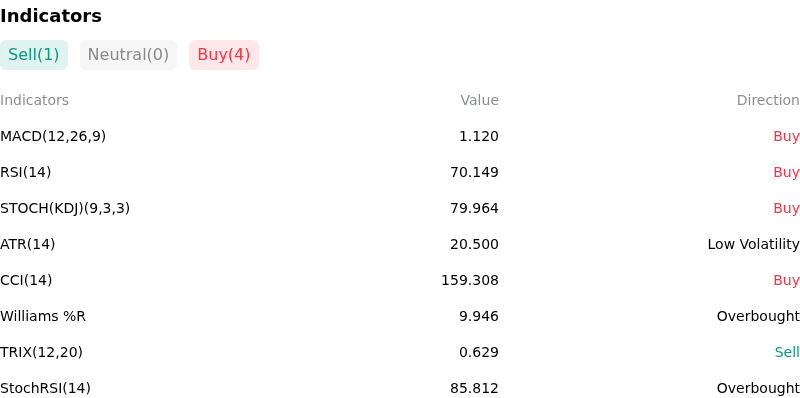
Technically, BNB (BNBUSD) shows a MACD (12,26,9) value of 1.120, indicating a buy signal. The RSI at 70.149 suggests buy condition and the Williams %R at 9.946 suggests overbought condition. Please monitor closely.
More details about BNB (BNBUSD)
Recent Events and Risks:
- Technical Rejection at Resistance and Overbought RSI: Following a derivative-fueled push into the $725–$730 resistance band, BNB experienced immediate sell-side rejection as technical momentum indicators hit overbought territory above 73 RSI. Subsequent profit-taking and leverage recalibration pushed prices down toward $713, leaving the token vulnerable to a breakdown below $690 toward its 20-day EMA near $668.
- Concentrated Downside Long Liquidation Clusters: Derivatives positioning remains heavily skewed to the long side, with open interest exceeding $1.1 billion. Liquidation heatmaps reveal over $80 million in long liquidations concentrated heavily between $683 and $702, creating an asymmetrical market structure where modest intraday drops threaten to trigger cascading forced liquidations.
- DeFi Collateral Risk and Venus Protocol Leverage Looping: High-leverage looping strategies across BNB Chain DeFi protocols—where whales lock BNB as collateral to borrow stablecoins—present systemic liquidations risk. Intraday price pullbacks threaten to trigger automated liquidation thresholds on platforms like Venus Protocol, aggravating spot market selling pressure.
- Regulatory Friction and Offshore Compliance Drag: Ongoing compliance burdens across the broader Binance ecosystem, including MiCA regulatory adjustments in Europe, mandatory transaction restrictions on non-compliant counterparties, and active regulatory oversight, continue to dampen institutional spot market liquidity and generate persistent headline risk.
Recommended Articles


