


Wheat Futures (WHEAT-F) Drops on Sep 3: What Lie behind the Move?
Wheat Futures (WHEAT-F) is down 2.00% at Sep 3 04:10(ET), now at $757.66, with a 7-day down of 0.26%.
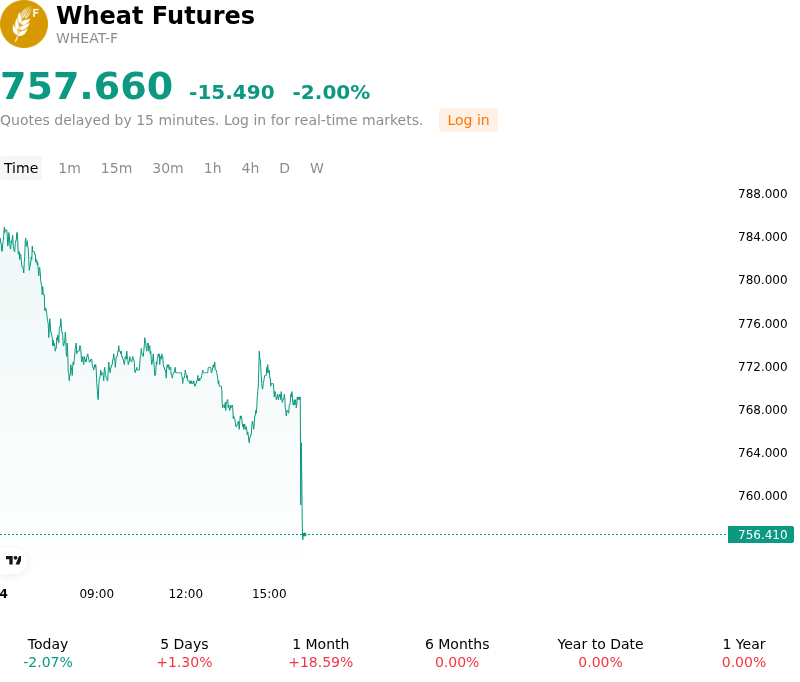
What is driving Wheat Futures (WHEAT-F)’s stock price down today?
Wheat futures experienced a retreat as market participants engaged in broad profit-taking, pausing a sustained multi-week rally that had previously pushed benchmark prices to multi-year highs. Speculative accounts and institutional traders trimmed net-long positioning ahead of key monthly crop estimates, opting to lock in gains after momentum indicators flagged overbought technical conditions. The pullback across major winter wheat contracts reflected a temporary fundamental repricing after weeks of aggressive risk-premium accumulation.
A central catalyst for the price decline was a moderation in Black Sea geopolitical risk premiums. Diplomatic efforts aimed at facilitating safe-passage shipping corridors for commercial maritime traffic in the Black Sea eased immediate market anxiety over acute supply disruptions. Although market participants remain cautious regarding the long-term stability of regional logistics, the potential for stabilized export flows encouraged funds to strip out a portion of the war-risk premium embedded in benchmark contracts.
Seasonal supply expansion across the Northern Hemisphere further reinforced the softer market tone. In North America, the accelerated pace of the spring wheat harvest—moving well ahead of its five-year historical average—flooded spot delivery points and country elevators with fresh physical grain, amplifying seasonal producer selling and commercial hedging pressure.
Concurrently, improved production forecasts from competing global export origins added to the downside momentum. Revised crop estimates for Southern Hemisphere exporters, including Australia following beneficial winter precipitation, pointed to expanded global export availability later in the marketing year. Combined with competitive pricing from alternative export hubs, these expanding supply expectations moderated near-term global deficit concerns, leading traders to re-evaluate the market balance.
Technical Analysis of Wheat Futures (WHEAT-F)
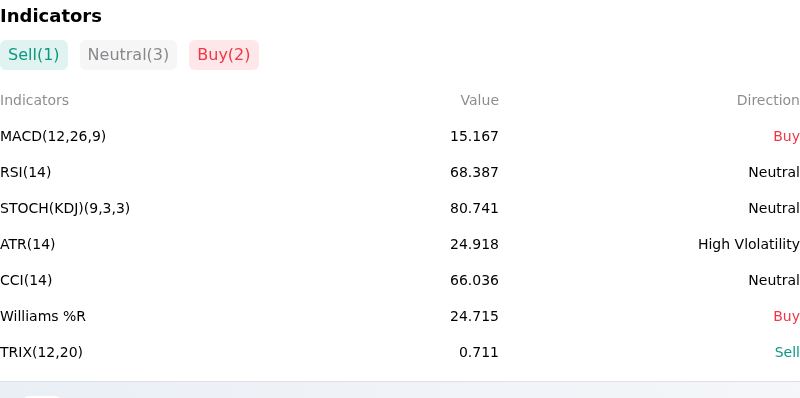
Technically, Wheat Futures (WHEAT-F) shows a MACD (12,26,9) value of 15.167, indicating a buy signal. The RSI at 68.387 suggests neutral condition and the Williams %R at 24.715 suggests buy condition. Please monitor closely.
More details about Wheat Futures (WHEAT-F)
Recent Events and Risks:
- Black Sea Safe-Passage Corridor Diplomacy: Diplomatic initiatives led by Türkiye to establish safe-passage shipping corridors in the Black Sea have triggered pullbacks in wheat futures, as market participants rapidly strip out geopolitical war-risk premiums previously priced into short-term contracts.
- Accelerated Spring Wheat Harvest Progress: Rapid harvest progression across North America—with U.S. spring wheat harvest reaching 77% completion, well ahead of historical averages—is steadily increasing physical grain availability across elevators and transit channels, imposing seasonal cash market pressure.
- Sluggish Export Demand and Uncompetitive Domestic Pricing: Official crop inspection reports show cumulative U.S. wheat export shipments lagging significantly behind year-ago levels, as elevated futures prices leave U.S.-origin grain at a severe price disadvantage compared to cheaper Black Sea cash offerings.
- Speculative Long Liquidation and Technical Profit-Taking: Following a multi-week surge to multi-year highs that drove technical indicators into overbought territory, speculative funds have initiated aggressive long liquidation and profit-taking, fueling sharp intraday downward volatility.
Recommended Articles


