


Ethereum (ETHUSD) Volatility Intensified on Aug 28: What You Should Know
Ethereum (ETHUSD) is down 1.04% at Aug 28 00:10(ET), now at $2479.28, with a 7-day up of 1.67%.
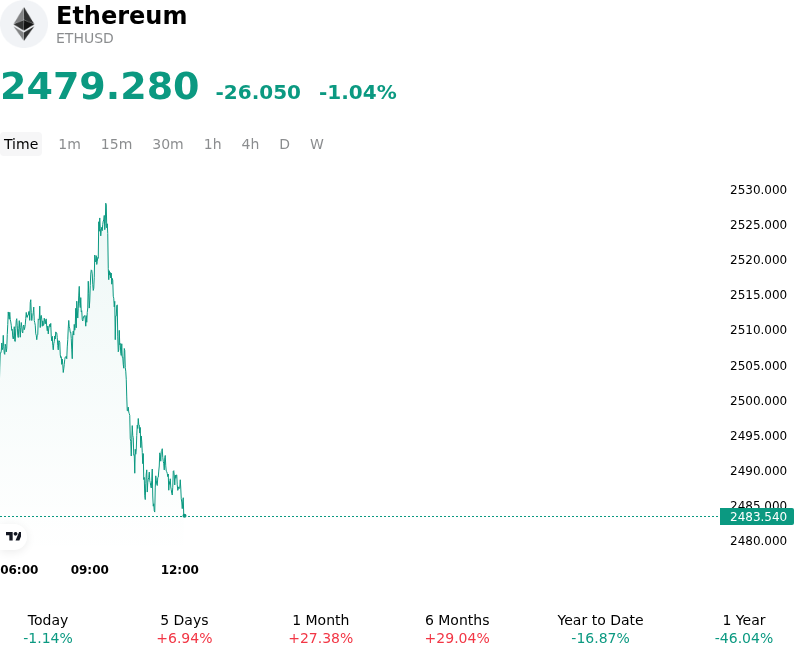
What is driving Ethereum (ETHUSD)’s stock price down today?
Institutional positioning and technical overbought conditions led to tactical profit-taking in Ethereum following a multi-session price expansion. After a sustained move toward key psychological resistance, momentum indicators reached elevated levels, prompting derivatives traders and short-term market participants to trim leveraged long exposure and realize gains. This temporary reduction in risk appetite resulted in spot selling pressure that outpaced immediate bid depth across major trading venues.
While institutional demand via spot Ethereum exchange-traded funds has shown underlying resilience over recent sessions, immediate spot accumulation experienced a brief lull relative to prior capital inflow velocity. Macroeconomic uncertainty also weighed on sentiment, as market participants reassessed global liquidity conditions and interest rate expectations ahead of upcoming Federal Reserve monetary policy announcements. Fluctuations in Treasury yields and broader market consolidation encouraged institutional investors to adopt a defensive posture, preventing secondary spot buying from breaking through overhead supply clusters.
Despite the temporary retracement, Ethereum's fundamental architecture and broader ecosystem metrics continue to demonstrate structural stability. Total value locked across decentralized finance protocols remains healthy, supported by active Layer-2 network utilization, robust liquid staking activity, and anticipated protocol throughput enhancements. The intraday pullback appears to reflect localized profit-taking and leverage reduction rather than a deterioration in network adoption, with institutional investors closely monitoring spot ETF flow metrics and macro liquidity signals for indications of trend re-acceleration.
Technical Analysis of Ethereum (ETHUSD)
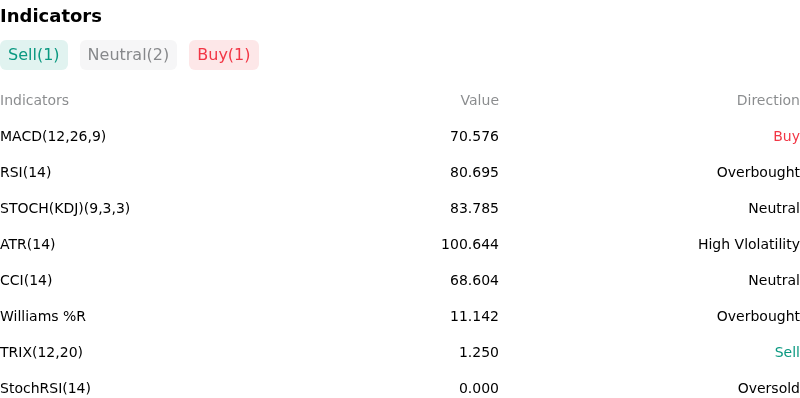
Technically, Ethereum (ETHUSD) shows a MACD (12,26,9) value of 70.576, indicating a buy signal. The RSI at 80.695 suggests overbought condition and the Williams %R at 11.142 suggests overbought condition. Please monitor closely.
More details about Ethereum (ETHUSD)
Recent Events and Risks:
- Long-Term Whale Capitulation and Exchange Inflows: Recent on-chain tracking shows multi-year Ethereum holders transferring large blocks of ETH—including a single 6,504 ETH deposit worth nearly $16 million—to centralized exchanges like Binance to sell at substantial realized losses, increasing immediate spot supply overhang.
- High Derivatives Leverage and Liquidation Risk: Aggressive high-leverage bets are building up on decentralized futures venues, highlighted by single-wallet 20x short positions exceeding $20 million, elevating the risk of sudden forced liquidation cascades and intraday price whipsaws.
- DeFi Protocol Exploits and Regulatory Scrutiny: Smart contract vulnerabilities on Ethereum-based lending protocols—such as the recent $8.5 million governance exploit draining Term Finance vaults—have drawn fresh regulatory warnings from the SEC regarding vault compliance, dampening investor confidence across the broader DeFi sector.
- Macro Uncertainty and Monetary Policy Pressure: Potential hawkish commentary from the Federal Reserve during macro policy events and sustained high bond yields threaten to weaken risk-on appetite, exposing high-beta crypto assets like Ethereum to downside capital reallocations.
Recommended Articles


