


Ripple and Stellar Outlook: XRP and XLM defend key levels, but recovery lags
- XRP rebounds after testing the $1.40 support level, but a stretched bullish MACD and RSI hint at near-term turbulence.
- XLM trades between the 100-day EMA support and the 200-day EMA resistance, as bulls battle for another breakout attempt.
- Retail participation remains stable but lacks the momentum needed to fuel a sustained bullish breakout.
Ripple (XRP) and Stellar (XLM) are showing signs of stability on Thursday, after defending key support levels at $1.40 and $0.18, respectively. This stability comes against a backdrop of XRP’s 72% rally, which tagged $1.70 last week, and XLM’s 47% rally to $0.22. Holding above the immediate support levels would reinforce the bullish outlook and increase the odds of a renewed uptrend.
Derivative data signs mixed bias
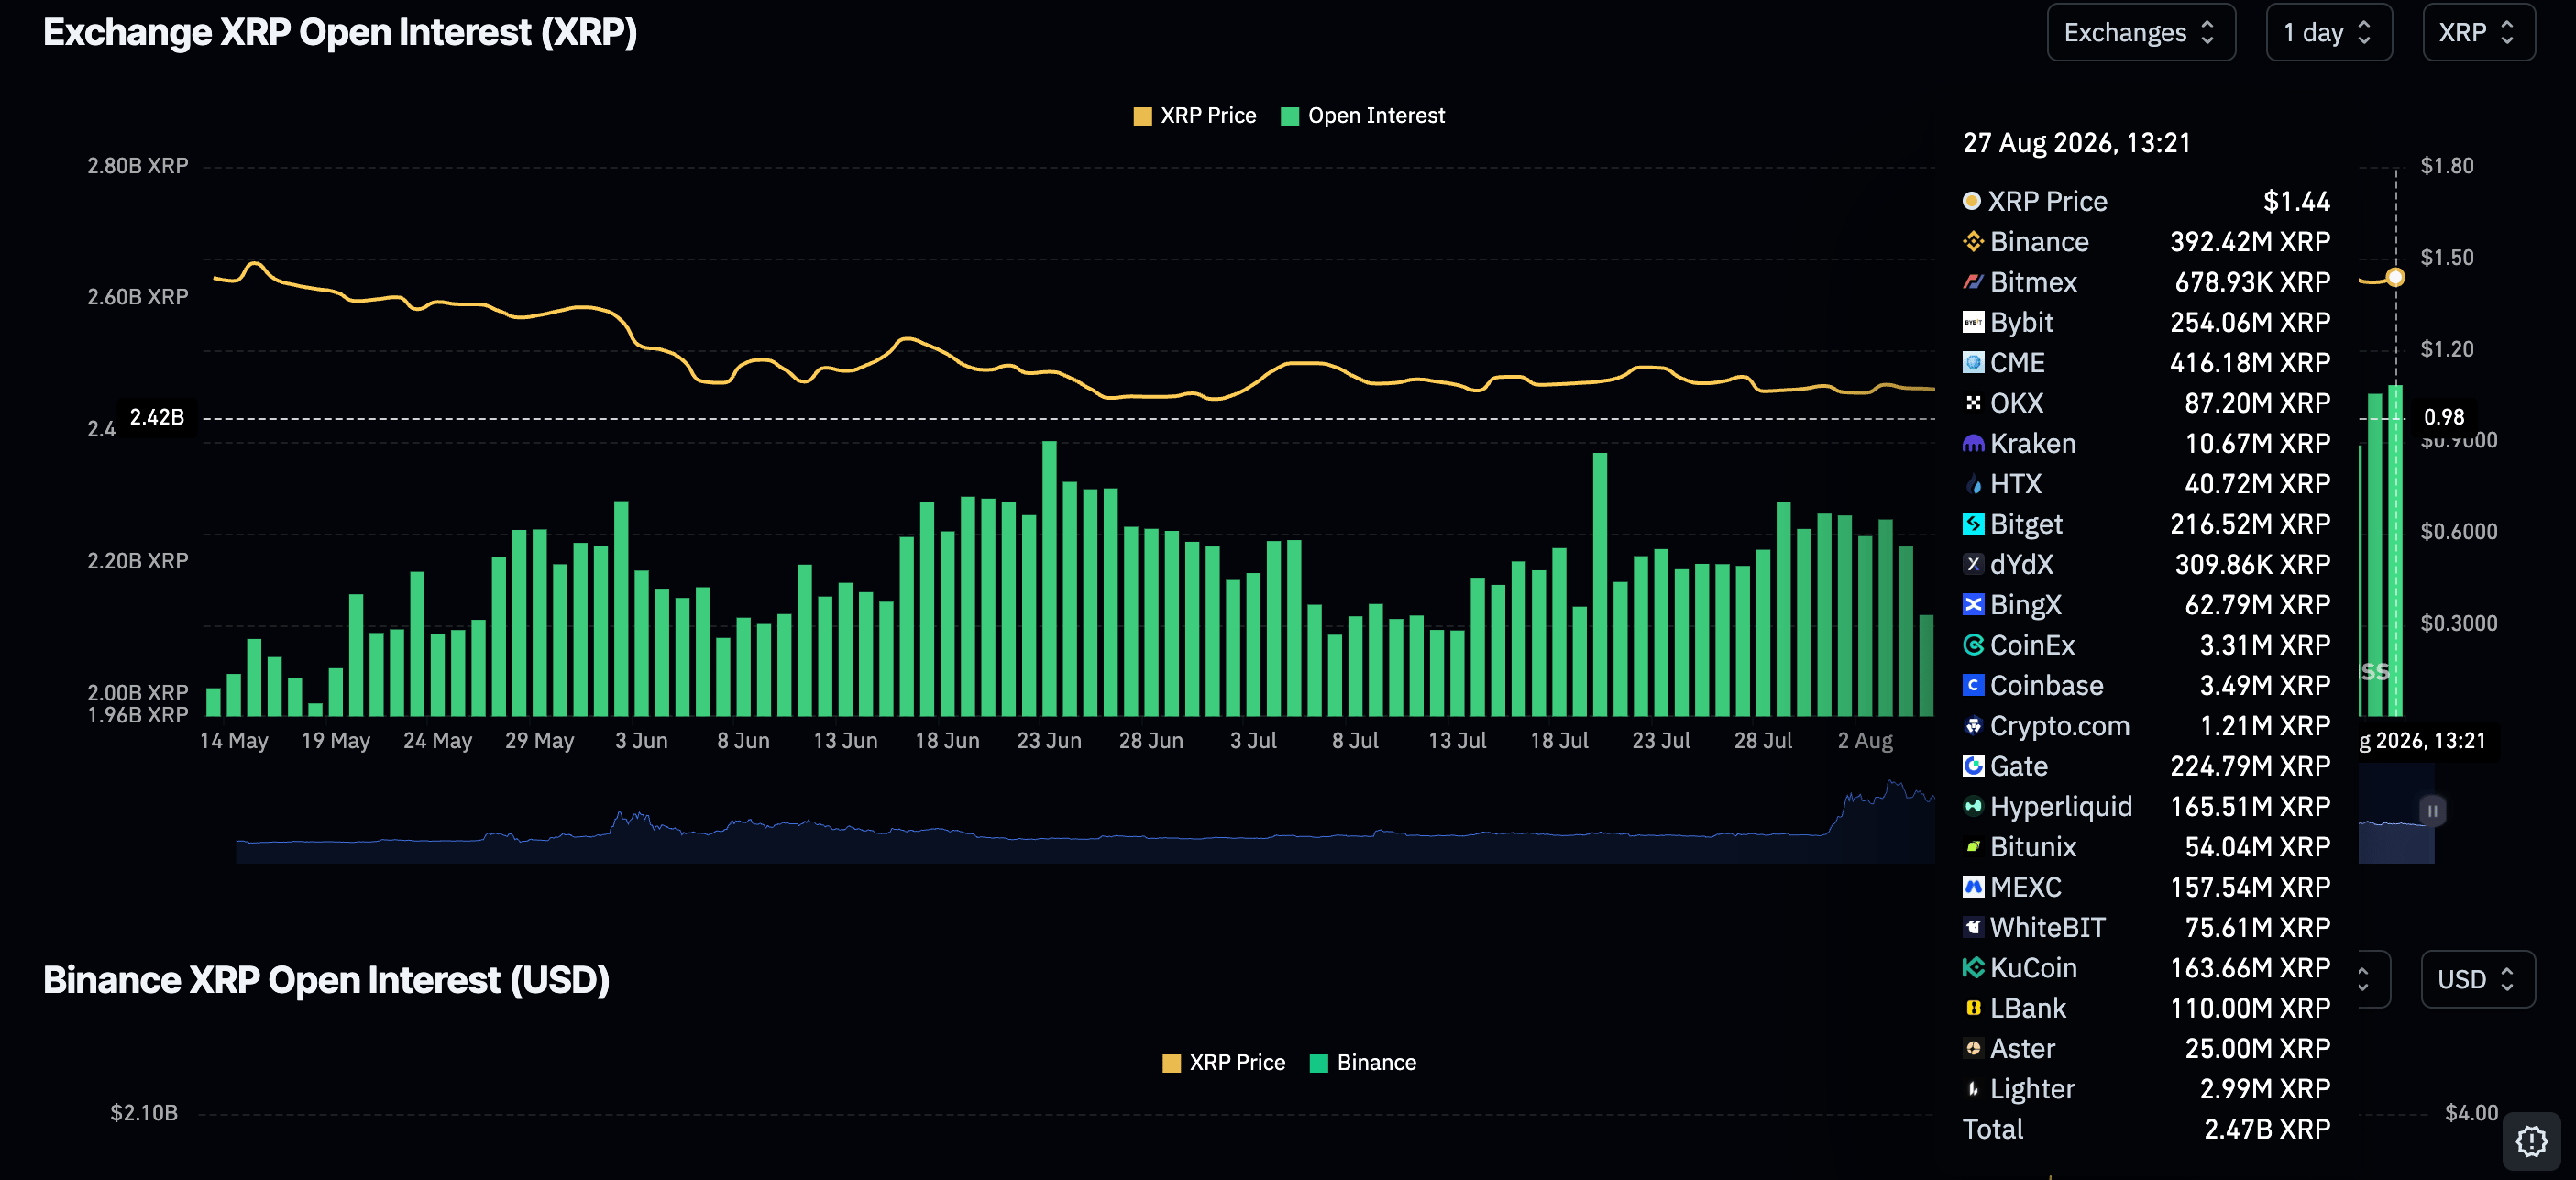
CoinGlass’s data shows cautious optimism as derivatives hold steady. The token’s futures Open Interest (OI) shows a minor decrease to 2.44 billion XRP on Thursday, from 2.38 billion XRP the day before. Looking back, OI holds higher than the 2.12 billion XRP recorded on August 12 but remains well below the monthly peak of 2.78 billion XRP.
Traders should stay cautious amid the mixed derivatives data. If a breakout ensues toward $1.70, retail investors would be encouraged to increase exposure. However, consolidation and extended losses may prompt risk-off sentiment.
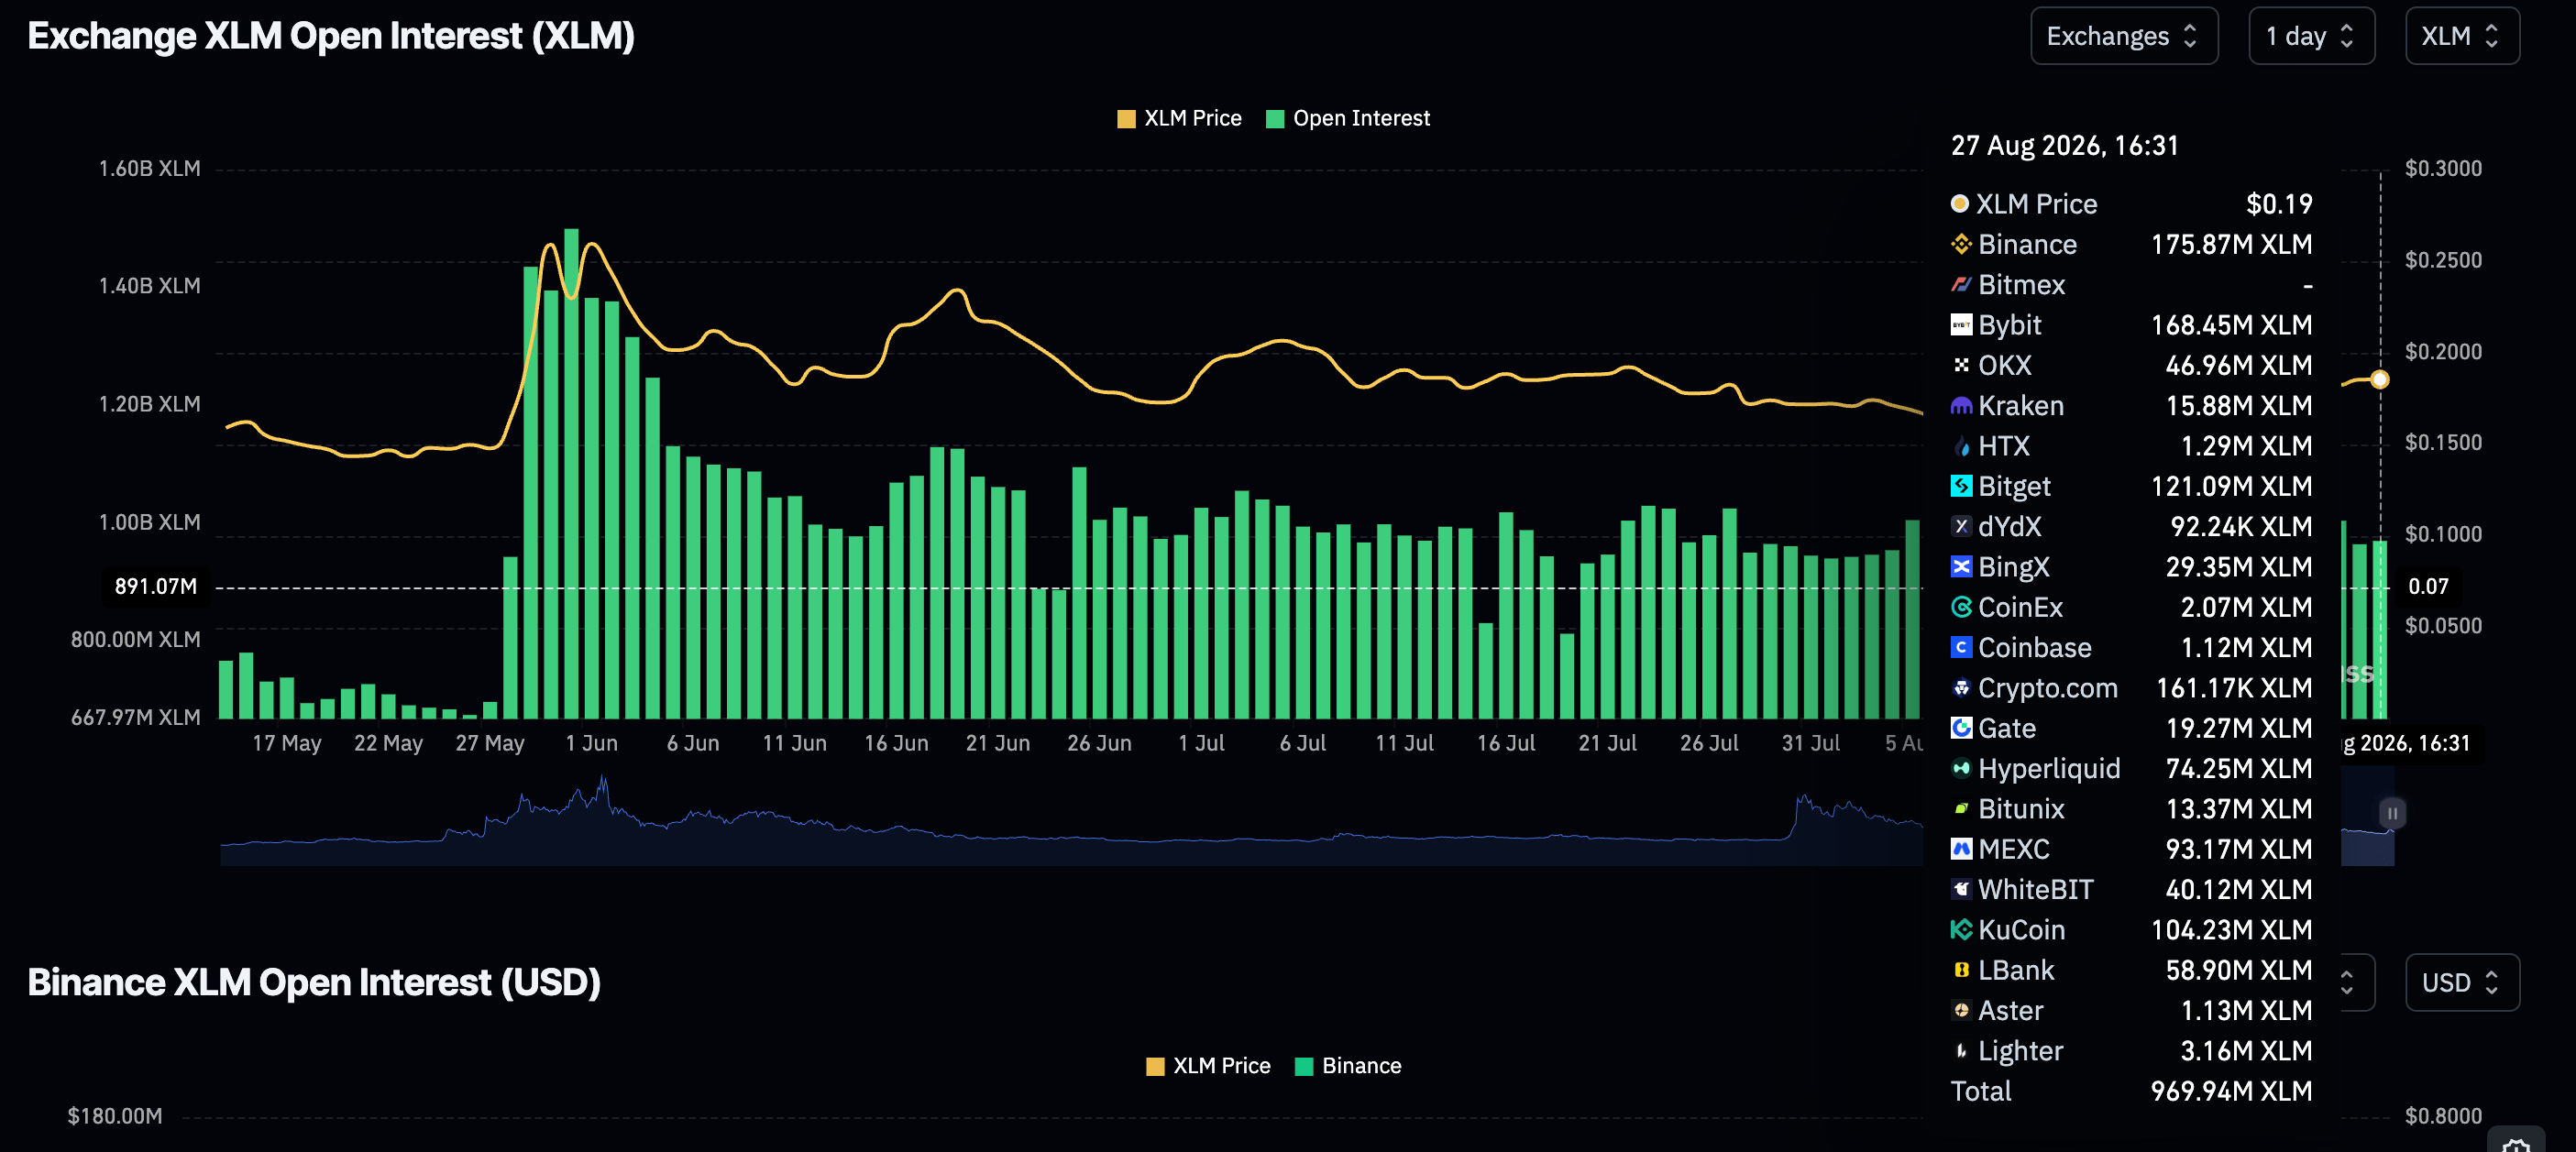
Meanwhile, Stellar derivatives show stabilizing futures OI at 964 million XLM on Thursday, down from approximately 1 billion XLM the previous day. Perpetual futures OI peaked at 1.23 billion in August, aligning with last week’s price breakout. It remains imperative to monitor the derivatives market, as rising OI could reinforce the bullish outlook. However, a persistent drop in OI would suggest growing risk-off sentiment, likely to curtail any recovery.
Technical outlook: XRP defends key support
XRP holds above the 50‑day, 100‑day, and 200‑day Exponential Moving Averages (EMAs), suggesting a firm bullish near‑term bias as price extends its breakout phase. Momentum remains elevated, with the Relative Strength Index (RSI) hovering in the low‑70s, while the Moving Average Convergence Divergence (MACD) stays positive and above its signal line, hinting that buyers still dominate despite increasingly stretched conditions.
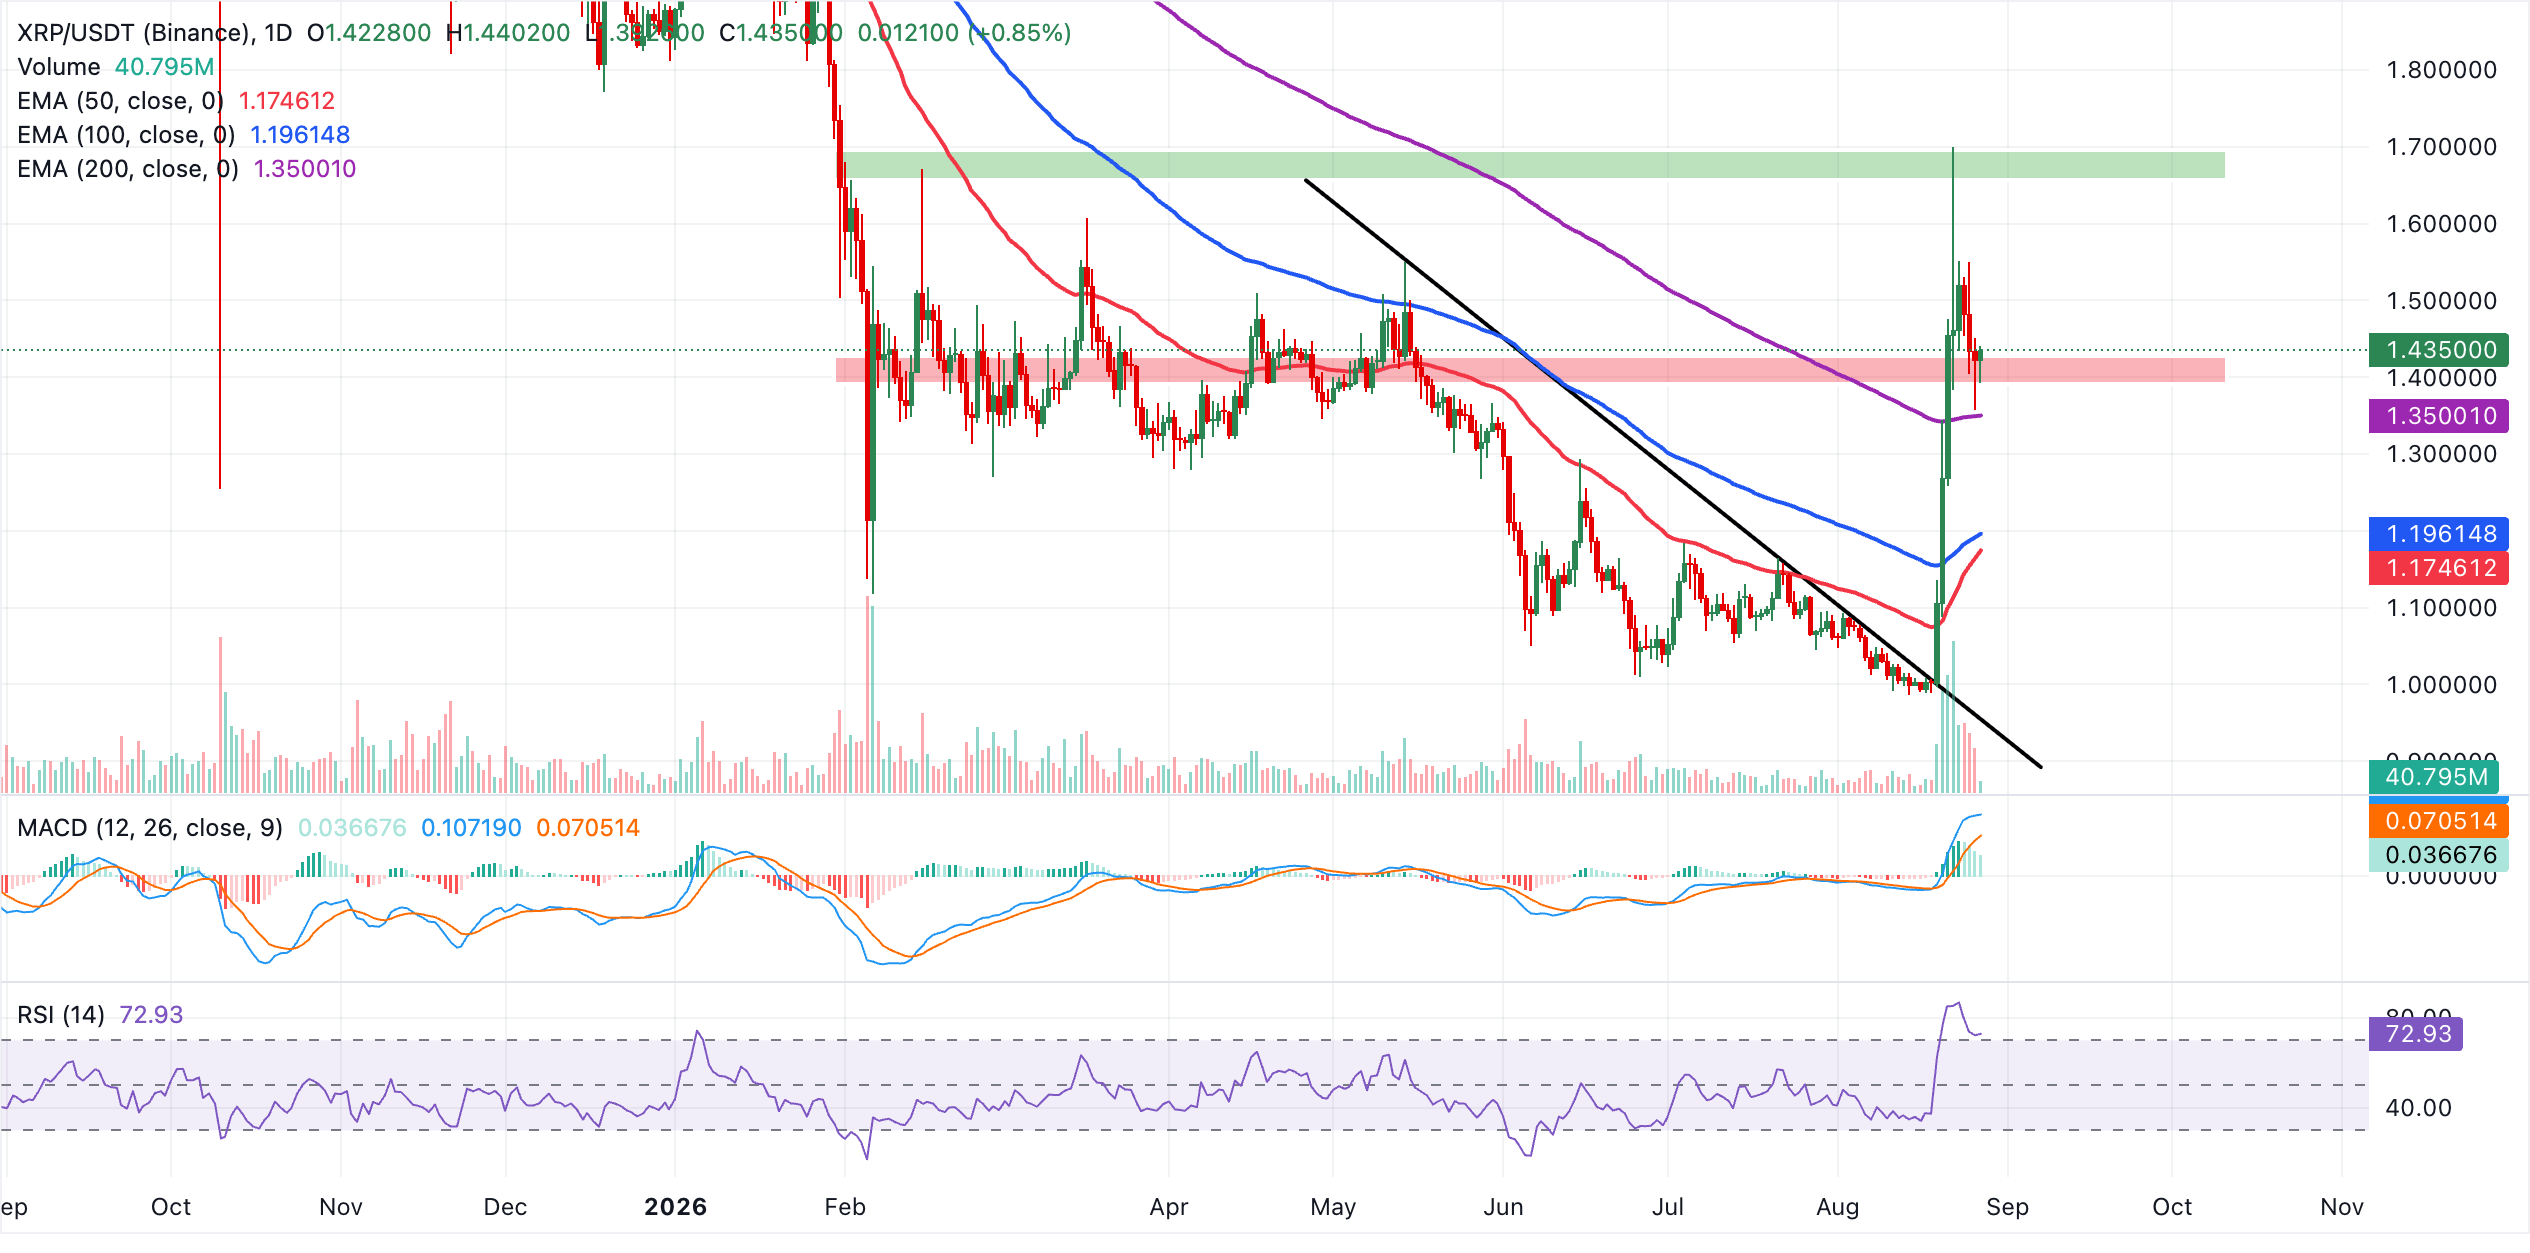
Immediate support lies at the current breakout area around $1.43, with secondary demand emerging at the 200-day EMA near $1.35 and deeper structural support aligned with the 100-day and 50-day EMAs at $1.20 and $1.17. On the topside, the next key hurdle is the round-figure $1.50 and the psychological $1.70, respectively. A clean push through this barrier would open the door for an extension of the uptrend toward higher levels in the coming sessions.
XLM technical outlook: Gathers momentum as support holds
XLM trades above $0.18, holding a neutral‑bullish near‑term tone as it remains above the 50‑day and 100‑day EMAs, but still capped beneath the 200‑day EMA at $0.19. The pair has recently rebounded from the mid-$0.15s, with the RSI hovering around 56, while the MACD stays above zero with a positive, though moderating, histogram. Together, these technical indicators suggest improving momentum but not a fully decisive bullish trend.
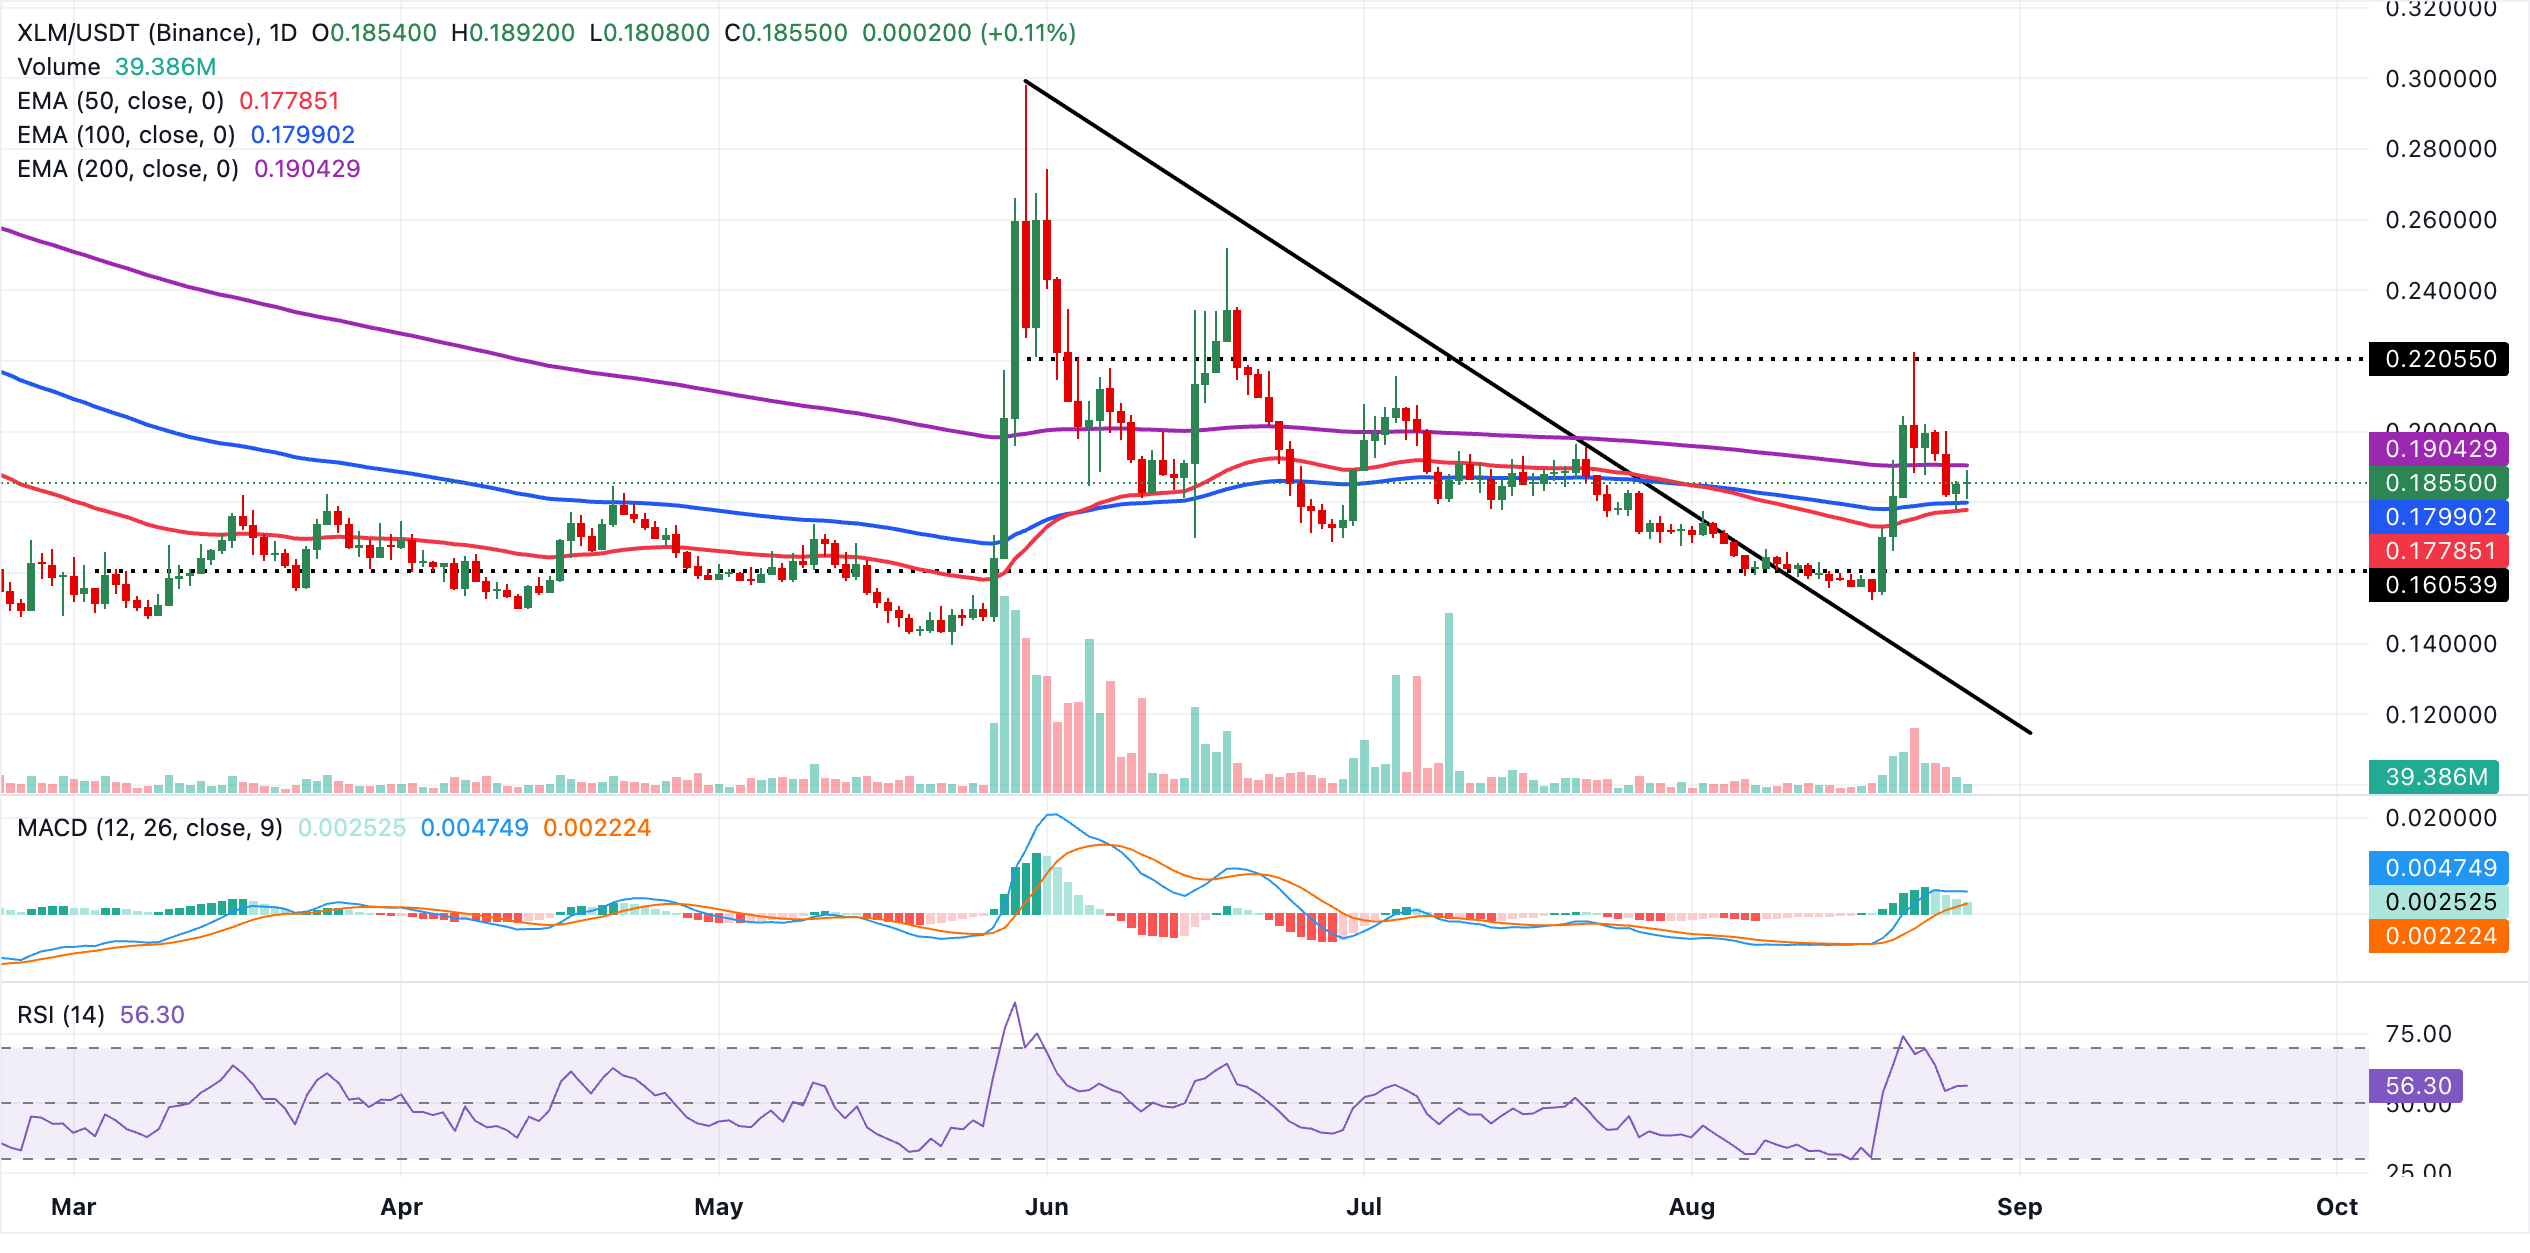
Immediate resistance lies at the 200-day EMA at roughly $0.19, with the horizontal line at $0.22 reinforcing a broader supply zone above the current price and limiting upside extension unless decisively broken.
On the downside, initial support is seen at the 100‑day EMA near $0.18, which coincides with the 50‑day EMA. As long as XLM holds above this EMA cluster, dips are likely to attract buyers, keeping the bias mildly constructive while the market consolidates below the $0.19 area.
(The technical analysis of this story was written with the help of an AI tool. Know more.)
Open Interest, funding rate FAQs
Higher Open Interest is associated with higher liquidity and new capital inflow to the market. This is considered the equivalent of increase in efficiency and the ongoing trend continues. When Open Interest decreases, it is considered a sign of liquidation in the market, investors are leaving and the overall demand for an asset is on a decline, fueling a bearish sentiment among investors.
Funding fees bridge the difference between spot prices and prices of futures contracts of an asset by increasing liquidation risks faced by traders. A consistently high and positive funding rate implies there is a bullish sentiment among market participants and there is an expectation of a price hike. A consistently negative funding rate for an asset implies a bearish sentiment, indicating that traders expect the cryptocurrency’s price to fall and a bearish trend reversal is likely to occur.
Recommended Articles


