


Solana (SOLUSD) Fluctuated Significantly on Aug 25: Key Variables Behind the Move
Solana (SOLUSD) is up 5.30% at Aug 25 00:00(ET), now at $100.61, with a 7-day up of 32.57%.
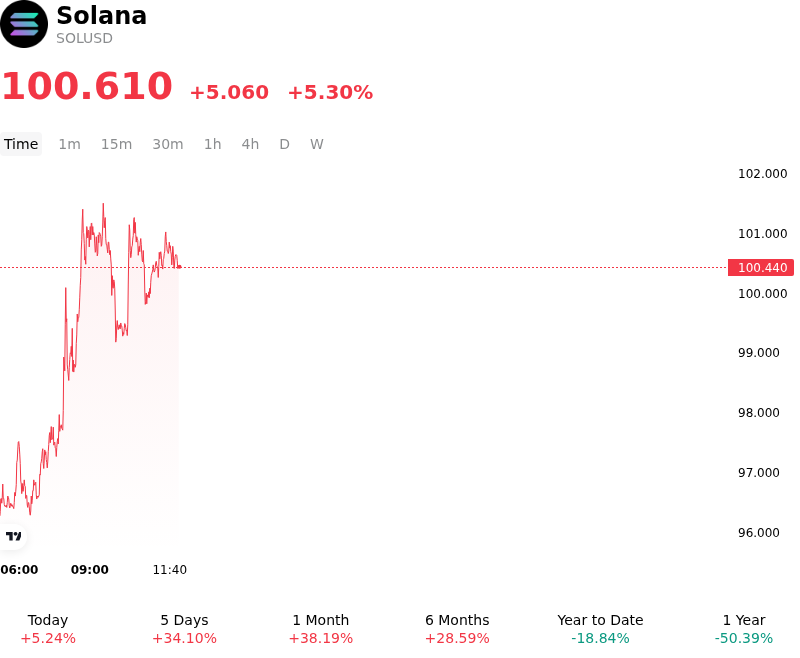
What is driving Solana (SOLUSD)’s stock price up today?
Capital moved into Solana as improving global macro liquidity conditions and strong spot Solana ETF inflows boosted institutional risk appetite. Broader macroeconomic expectations, bolstered by Treasury liquidity support operations and stabilizing bond yields, created a constructive environment for high-beta smart contract assets. Institutional participation gathered momentum as dedicated spot Solana exchange-traded products recorded substantial net inflows, indicating that institutional investors are continuing to build long-term exposure to the asset.
Network-specific catalysts further supported investor sentiment and enhanced growth expectations. On-chain governance initiatives aimed at accelerating the token disinflation schedule and optimizing fee-burning structures brought renewed focus to long-term supply dynamics. Concurrently, technical progress on network infrastructure—including protocol upgrades designed to expand transaction payload sizes and boost overall throughput—underscored Solana's competitive positioning. Combined with high transaction activity in tokenized real-world assets and decentralized finance applications, these fundamental developments reinforced confidence in the ecosystem's adoption trajectory.
Market mechanics and derivatives positioning significantly amplified the upward price movement. As the asset pushed past critical psychological resistance levels, short sellers were forced into involuntary liquidations, creating a classic short squeeze across perpetual and futures markets. This forced buying mechanically accelerated buying pressure, driving swift price appreciation. While short-term derivative leverage raises the potential for localized volatility, the convergence of sustained ETF inflows, constructive supply governance, and favorable macro liquidity indicates a structural repricing underpinned by expanding institutional demand.
Technical Analysis of Solana (SOLUSD)
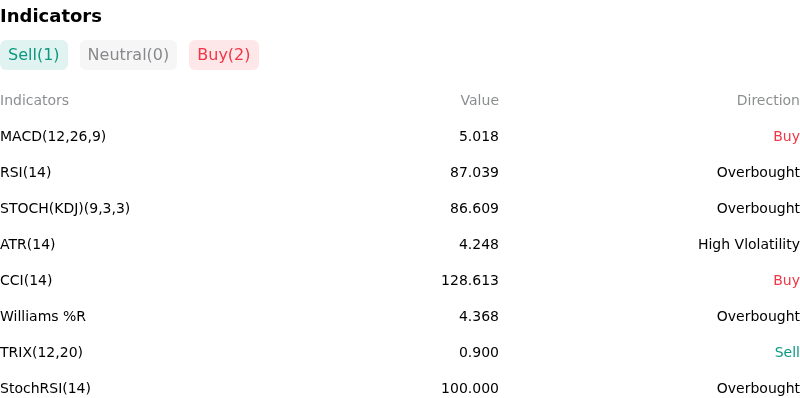
Technically, Solana (SOLUSD) shows a MACD (12,26,9) value of 5.018, indicating a buy signal. The RSI at 87.039 suggests overbought condition and the Williams %R at 4.368 suggests overbought condition. Please monitor closely.
More details about Solana (SOLUSD)
Recent Events and Risks:
- Overhead Resistance Rejection and Bearish Technical Divergence: Following a rapid squeeze toward the $98–$102 region, SOL failed to secure a daily close above key resistance. Short-term technical metrics, such as a 4-hour MACD bearish crossover, signal fading buying momentum, raising the probability of a retracement toward support levels at $94.58 and $88.06.
- Leverage Overhang and Downside Liquidation Cascades: Because the recent rally was predominantly fueled by forced short liquidations rather than aggressive spot buying, open interest remains heavily weighted toward leveraged long positions. Liquidation maps indicate dense long liquidation pools between $91.50 and $93.00, exposing the market to accelerated intraday sell-offs if price breaks below $94.00.
- Cooling Institutional Demand and Inconsistent ETF Flows: Primary-market flows into spot Solana ETFs continue to show intermittent stalls and cooling periods. A lack of sustained, organic spot ETF demand leaves high-beta SOL vulnerable to sudden drawdowns whenever broad crypto risk appetite wanes or Treasury yields firm up.
- Ecosystem Governance Friction and Supply Disinflation Debate: Ongoing validator votes and contentious proposals surrounding Solana fee burn increases and accelerated disinflation have created policy uncertainty. Frictional debates between community stakeholders regarding transaction fee structures and annual issuance rates are introducing governance-driven volatility into intraday market sentiment.
Recommended Articles


