


Applied Materials Inc Stock (AMAT) Moved Down by 3.16% on Aug 19: Facts Behind the Movement
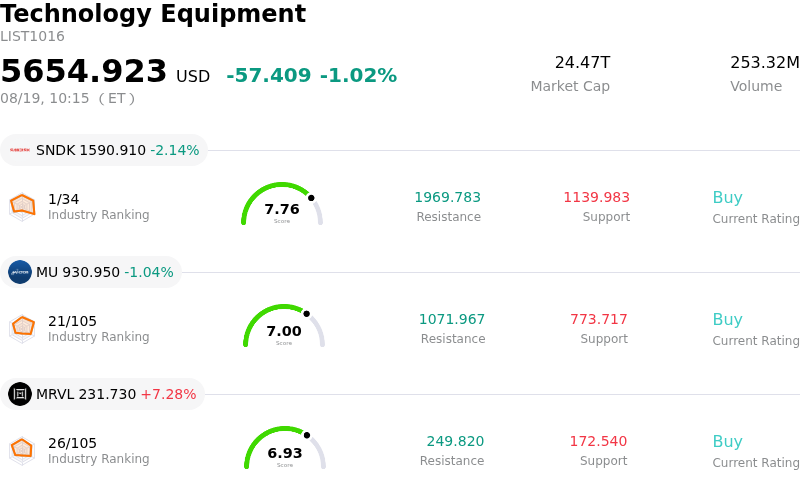
Applied Materials Inc (AMAT) moved down by 3.16%. The Technology Equipment sector is down by 1.02%. The company underperformed the industry. Top 3 stocks by turnover in the sector: SanDisk Corporation (SNDK) down 2.14%; Micron Technology Inc (MU) down 1.04%; Marvell Technology Inc (MRVL) up 7.87%.
What is driving Applied Materials Inc (AMAT)’s stock price down today?
Applied Materials experienced noticeable downward pressure and elevated intraday volatility as the broader semiconductor sector faced profit-taking and macroeconomic headwinds. Despite the company recently delivering strong fiscal third-quarter results that surpassed Wall Street estimates alongside robust forward revenue guidance, market sentiment has turned increasingly cautious. Investors are scrutinizing the sustainability of chip equipment spending and reassessing high valuations after an extended rally across artificial intelligence-linked semiconductor equipment names.
A key contributor to the stock pull-back is investor focus on operational margins and relative growth execution. Although Applied Materials projected strong sales momentum powered by demand for AI infrastructure, high-bandwidth memory, and advanced packaging, its gross margin outlook remained essentially flat sequentially. Following a significant surge in stock price over recent quarters, market participants had set an exceptionally high bar for financial performance. Unmet expectations regarding margin expansion and concerns that growth might lag key semiconductor equipment peers prompted institutional portfolio adjustments and profit-taking.
Broader industry dynamics and macroeconomic factors also weighed on the shares. Broader weakness across the Philadelphia Semiconductor Index, driven by rising long-term Treasury yields and elevated discount rates, created widespread valuation pressure on capital-intensive technology stocks. Additionally, market commentary questioning the long-term durability of massive corporate AI capital expenditures, alongside ongoing geopolitical and supply chain considerations, has fueled risk-off sentiment. These sector-wide headwinds, combined with recent insider share sales, have amplified volatility as traders lock in gains and reset positioning.
Despite near-term volatility and valuation concerns, Applied Materials maintains strong secular tailwinds tied to leading-edge logic, memory, and packaging capacity expansions. Management continues to signal expanding manufacturing capacity to meet long-term customer visibility through the late 2020s. However, in the immediate term, high expectations, peer competitive comparisons, and macro-driven market digestion remain the primary catalysts behind the stock's downside movement.
Technical Analysis of Applied Materials Inc (AMAT)
Technically, Applied Materials Inc (AMAT) shows a MACD (12,26,9) value of 2.366, indicating a neutral signal. The RSI at 46.579 suggests neutral condition and the Williams %R at 56.399 suggests sell condition. Please monitor closely.
Media Coverage of Applied Materials Inc (AMAT)
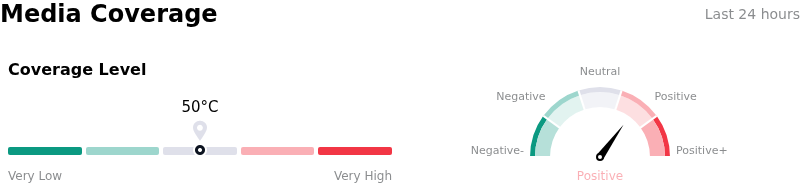
In terms of media coverage, Applied Materials Inc (AMAT) shows a coverage score of 50, indicating a moderate level of media attention. The overall market sentiment index is currently in bullish zone.
Fundamental Analysis of Applied Materials Inc (AMAT)
Applied Materials Inc (AMAT) is in the Technology Equipment industry. Its latest annual revenue is $28.37B, ranking 11 in the industry. The net profit is $7.00B, ranking 8 in the industry. Company Profile
Over the past month, multiple analysts have rated the company as Buy, with an average price target of $636.63, a high of $900.00, and a low of $308.00.
More details about Applied Materials Inc (AMAT)
Company Specific Risks:
- Valuation Multiples and Elevated Expectations: Following a sharp stock run-up, Applied Materials trades at an elevated forward earnings multiple above 30x, leaving the share price highly vulnerable to intraday volatility when record financial results fail to clear lofty market whisper expectations.
- Gross Margin Stagnation and Sequential Deceleration: Institutional analysts highlighted a pause in non-GAAP gross margin expansion near 50.4% alongside moderating sequential revenue growth rates, raising concerns over cost pressures and product mix headwinds as equipment shipments scale.
- China Revenue Contraction and Regulatory Export Controls: Revenue contribution from China fell to 28% of total sales from 35%, reflecting ongoing U.S. export restriction risks, geopolitical trade friction, and elevated revenue volatility in key international semiconductor markets.
- Competitive Pressure from Wafer-Fab Equipment Peers: Market participants express concern over whether Applied Materials can translate booming AI chip capex into revenue growth that reliably outpaces primary wafer fabrication competitors like Lam Research, KLA, and ASML.
Recommended Articles


