


Applied Materials Inc Stock (AMAT) Opened Down by 4.09% on Aug 18: Facts Behind the Movement
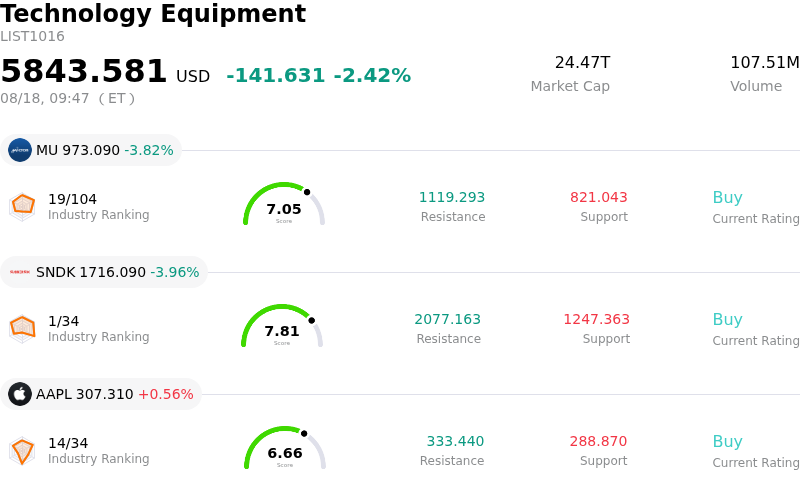
Applied Materials Inc (AMAT) opened down by 4.09%. The Technology Equipment sector is down by 2.42%. The company underperformed the industry. Top 3 stocks by turnover in the sector: Micron Technology Inc (MU) down 4.58%; SanDisk Corporation (SNDK) down 4.62%; Apple Inc (AAPL) up 0.56%.
What is driving Applied Materials Inc (AMAT)’s stock price down today?
Applied Materials experienced downside pressure as market participants continued to digest the company's fiscal third-quarter financial results and forward-looking guidance. Although the semiconductor equipment manufacturer reported record quarterly revenue and earnings per share that surpassed Wall Street consensus estimates alongside raised guidance for the fourth quarter, the stock encountered profit-taking and valuation repricing. Following an extended multi-month rally driven by enthusiasm around artificial intelligence infrastructure spending, market sentiment had grown increasingly sensitive to any fundamental details that failed to exceed elevated expectations.
The primary catalyst behind the weakness centers on gross margin expectations and geographic revenue composition. While demand for advanced packaging, high-bandwidth memory, and leading-edge foundry tools remains strong, investors reacted cautiously to a flat quarter-over-quarter gross margin outlook. The lack of expanding operating leverage despite accelerating top-line growth created hesitation among institutional buyers. Furthermore, a declining revenue share from customers in China highlighted persistent trade and geopolitical risks, prompting some funds to trim exposure.
From an institutional market strategy perspective, the movement reflects a broader valuation reset across the semiconductor capital equipment group rather than an operational breakdown. Shares had entered the earnings window priced for perfection, leaving limited room for immediate upside without upside margin expansion. Despite long-term tailwinds from expanded fabrication capacity investments and strategic research partnerships targeting next-generation silicon architectures, near-term price action remains constrained by sector-wide portfolio rebalancing and recalibrated expectations around capital spending efficiency among key global semiconductor foundries.
Technical Analysis of Applied Materials Inc (AMAT)
Technically, Applied Materials Inc (AMAT) shows a MACD (12,26,9) value of 4.279, indicating a neutral signal. The RSI at 50.050 suggests neutral condition and the Williams %R at 22.323 suggests buy condition. Please monitor closely.
Media Coverage of Applied Materials Inc (AMAT)
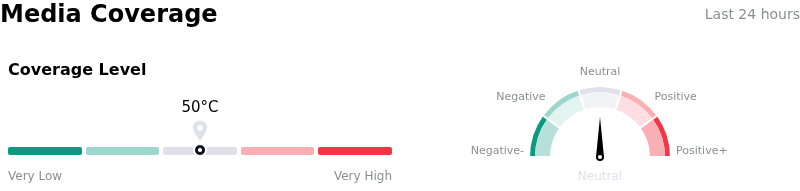
In terms of media coverage, Applied Materials Inc (AMAT) shows a coverage score of 50, indicating a moderate level of media attention. The overall market sentiment index is currently in neutral zone.
Fundamental Analysis of Applied Materials Inc (AMAT)
Applied Materials Inc (AMAT) is in the Technology Equipment industry. Its latest annual revenue is $28.37B, ranking 11 in the industry. The net profit is $7.00B, ranking 8 in the industry. Company Profile
Over the past month, multiple analysts have rated the company as Buy, with an average price target of $635.19, a high of $900.00, and a low of $308.00.
More details about Applied Materials Inc (AMAT)
Company Specific Risks:
- Flat Gross Margin Outlook and OpEx Expansion: Management guided Q4 fiscal 2026 non-GAAP gross margins to 50.4%, remaining flat sequentially despite significant revenue growth, while operating expenses are projected to rise to $1.58 billion, sparking institutional concerns over near-term margin stagnation as operational scaling costs increase.
- Omission of Systems Guidance and Production Capacity Limits: Wall Street reacted coolly to management withholding specific next-year guidance for the systems business, coupled with executive disclosures that physical manufacturing capacity constraints—rather than market demand—have become the primary bottleneck for delivering orders.
- Geopolitical Export Controls and Shrinking China Revenue Mix: Dynamic US export controls and tightening trade restrictions forced China's contribution to total revenue down to 28% from 35% in prior periods, intensifying fears of ongoing regulatory headwinds and demand deceleration in key Asian markets.
- Elevated Valuation and Wall Street Price Target Revisions: Trading at forward earnings multiples above 30x following a sharp multi-month surge, the stock faces heightened vulnerability to profit-taking, as evidenced by institutional price target trims (e.g., Morgan Stanley lowering its target to $642) on concerns that the AI capital expenditure cycle is already fully priced in.
Recommended Articles


