


Solana (SOLUSD) Is down 1.17% on Aug 10: Key Drivers to Watch
Solana (SOLUSD) is down 1.17% at Aug 10 09:40(ET), now at $75.38, with a 7-day up of 3.46%.
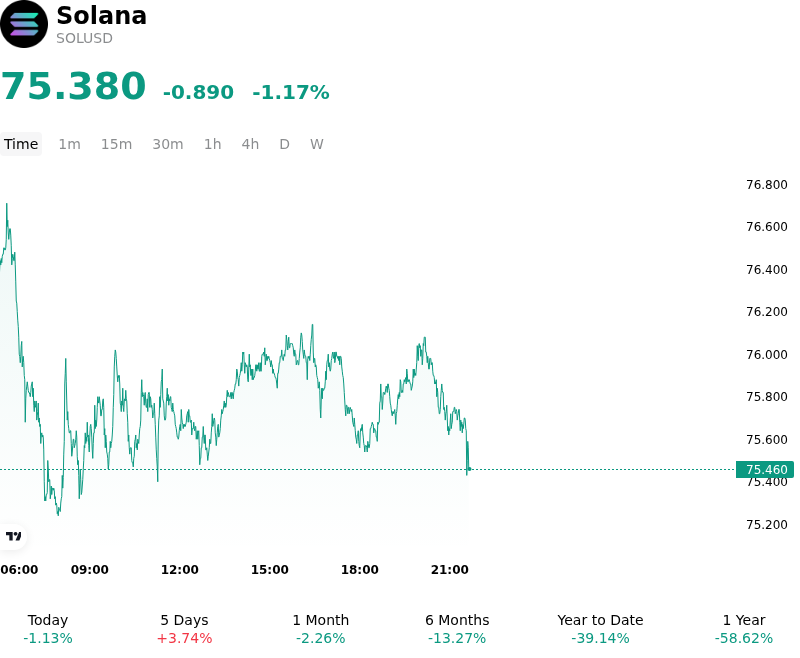
What is driving Solana (SOLUSD)’s stock price down today?
Solana’s intraday volatility reflects a broader recalibration of risk-on positions within the digital asset market, primarily driven by a resurgence in US Treasury yields and a strengthening US dollar. As macro liquidity conditions tightened slightly, institutional investors appear to be rotating out of high-growth Layer-1 assets into safer yielding instruments. This shift in capital flows is particularly evident in the Solana ecosystem, which has historically shown a high sensitivity to shifts in global discount rates and Federal Reserve policy expectations.
On-chain data suggests a cooling of decentralized exchange activity and a reduction in total value locked within Solana’s liquid staking protocols. This indicates a temporary pause in the aggressive ecosystem expansion seen throughout the earlier part of the summer. Furthermore, the derivatives market experienced a concentrated flush of long positions as price action tested key psychological support levels. This deleveraging event exacerbated the downward pressure, as automated liquidations on perpetual futures platforms forced a rapid reduction in speculative exposure.
The institutional narrative surrounding spot Solana ETF flows also contributed to the cautious sentiment. Recent data indicates a deceleration in net inflows to Solana-based investment products, suggesting that institutional demand may be reaching a saturation point in the short term. Additionally, regulatory uncertainty regarding the classification of certain ecosystem-native tokens continues to act as a headwind, prompting some large-scale holders to reduce their concentration risk in favor of more established digital assets or cash equivalents.
Despite the immediate price correction, the underlying network fundamentals remain robust, with high transaction throughput and continued developer commitment. However, the current market environment is characterized by a preference for liquidity and capital preservation over the high-beta returns offered by the Solana network. Market participants remain focused on upcoming macroeconomic data releases and Federal Reserve commentary that will clarify the trajectory of global liquidity into the final quarter of the year.
Technical Analysis of Solana (SOLUSD)
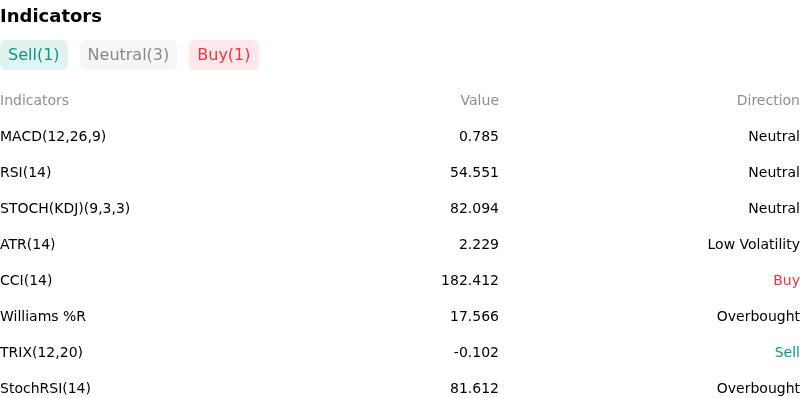
Technically, Solana (SOLUSD) shows a MACD (12,26,9) value of 0.799, indicating a neutral signal. The RSI at 54.903 suggests neutral condition and the Williams %R at 16.044 suggests overbought condition. Please monitor closely.
More details about Solana (SOLUSD)
Recent Events and Risks:
- FTX Estate Supply Overhang: The ongoing liquidation process of the FTX/Alameda bankruptcy estate remains a primary source of structural sell pressure, as periodic transfers of large SOL tranches to centralized exchanges for OTC or spot sales frequently dampen price recoveries and exhaust intraday liquidity.
- ETF Regulatory Uncertainty: While speculative interest has grown following spot ETF filings, the lack of a pre-existing federally regulated futures market for Solana increases the risk of SEC disapproval or indefinite delays, potentially leading to a sharp "sell-the-news" reaction if regulatory progress stalls.
- Leverage and Liquidation Cascades: SOLUSD currently exhibits a high concentration of speculative long positions in the perpetual swap markets, making the asset particularly vulnerable to rapid deleveraging events and liquidation cascades during periods of broader market risk-off sentiment.
- Network Performance and Reliability Concerns: Despite recent upgrades, the network remains susceptible to transaction failures and congestion driven by high-frequency MEV bot activity, which poses a recurring operational risk that can trigger sudden loss of investor confidence and intraday price volatility.
Recommended Articles


