


Solana (SOLUSD) Is down 1.51% on Jul 29: Key Drivers to Watch
Solana (SOLUSD) is down 1.51% at Jul 29 00:05(ET), now at $71.95, with a 7-day down of 6.32%.
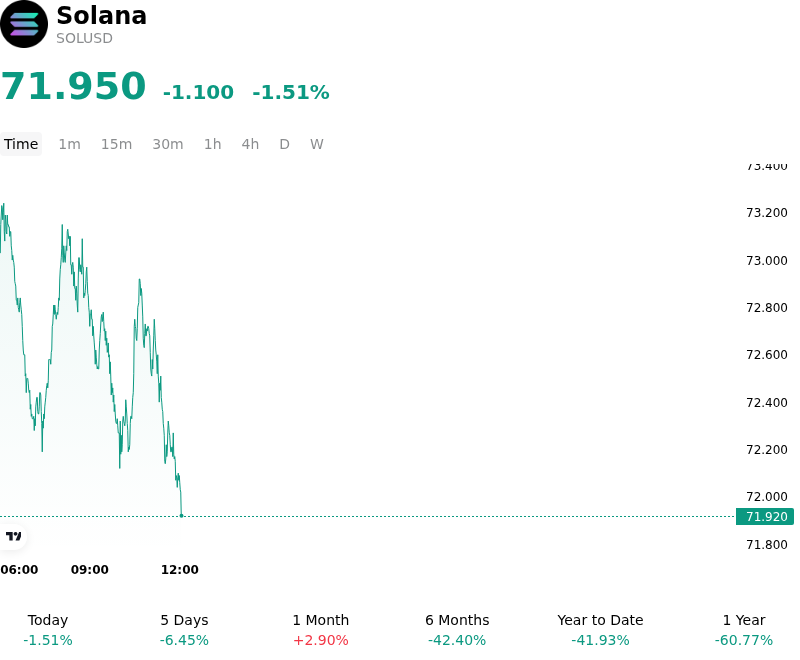
What is driving Solana (SOLUSD)’s stock price down today?
The decline in Solana during the current session primarily reflects a broader shift in global macro liquidity and a tactical reduction in risk exposure by institutional participants. As U.S. Treasury yields experienced a marginal uptick following recent economic data, investor appetite for high-beta digital assets cooled. This macro-driven pressure was compounded by a strengthening U.S. Dollar Index, which traditionally creates headwinds for the digital asset complex by tightening financial conditions and reducing the appeal of non-yielding assets.
Within the Solana ecosystem, the price action appears to be driven by a slowdown in institutional inflows through regulated investment vehicles. After a period of consistent accumulation, market participants are likely engaging in profit-taking as the asset tests significant psychological price levels. The absence of immediate catalysts from the decentralized finance or enterprise adoption sectors has allowed for a period of consolidation, as capital flows stabilize following recent expansion.
On-chain data suggests a shift in liquidity dynamics, with a moderate increase in exchange inflows indicating a preference for realized gains over long-term staking in the short term. While the underlying network fundamentals remain robust, with high transaction throughput and sustained developer activity, the current volatility is largely a function of derivatives positioning. A cluster of long liquidations in the perpetual futures market accelerated the downward move, as leveraged positions were flushed out amid the intraday retracement.
Furthermore, market sentiment is being influenced by broader regulatory considerations regarding the evolution of the Layer-1 landscape. While institutional adoption of Solana continues to mature, investors remain sensitive to shifts in the global regulatory framework, leading to a more cautious approach to capital allocation. This environment of heightened sensitivity to both macro and regulatory signals suggests that the current pullback is a normalization of sentiment and a recalibration of risk-weighted portfolios rather than a fundamental shift in the network's growth trajectory.
Technical Analysis of Solana (SOLUSD)
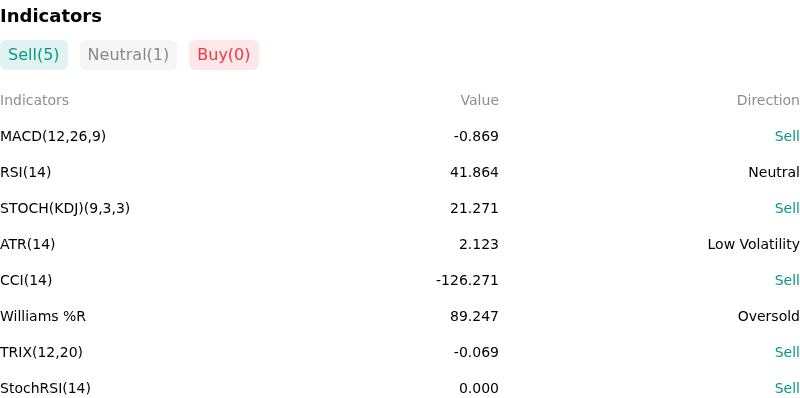
Technically, Solana (SOLUSD) shows a MACD (12,26,9) value of -0.869, indicating a sell signal. The RSI at 41.864 suggests neutral condition and the Williams %R at 89.247 suggests oversold condition. Please monitor closely.
More details about Solana (SOLUSD)
Recent Events and Risks:
- Technical Support Inversion: Solana (SOL) recently failed to reclaim the $77–$78 resistance zone and broke below the $75 pivot, effectively flipping the $75 level from support into a new overhead resistance. This technical breakdown on the 4-hour chart has shifted short-term momentum to the downside, with analysts targeting the $70 and $64.30 support floors if the current consolidation below $73 persists.
- Accelerated Long Liquidations: A sharp 5% decline in the last 24 hours has triggered a liquidation cascade as SOL sliced through a major liquidity band at $75, forcing the closure of leveraged long positions. On-chain heatmap data indicates high-density liquidation clusters remain concentrated near the $72.40 and $72.70 levels, posing a persistent threat of further volatility-induced "stop-hunts" in the immediate term.
- Stagnating On-Chain Demand: Despite elevated active address counts, Solana’s decentralized exchange (DEX) trading volumes have contracted by approximately 5.3% over the past week. This divergence suggests that network utility is currently failing to translate into sustained market demand, leaving the asset vulnerable to price stagnation and highly sensitive to broader sector-wide sell-offs.
- Ecosystem Capital Rotation: SOL has demonstrated relative weakness against Ethereum (ETH) over the last 48 hours, as institutional flows appear to be rotating away from Solana-based assets. This shift in market structure, combined with a 4-hour Relative Strength Index (RSI) of 35.57, indicates that sellers maintain control and that SOL currently lacks the idiosyncratic strength to decouple from Bitcoin-led market pressure.
Recommended Articles


