


Solana (SOLUSD) Is down 3.60% on Jul 28: Key Drivers to Watch
Solana (SOLUSD) is down 3.60% at Jul 28 00:00(ET), now at $72.28, with a 7-day down of 6.02%.
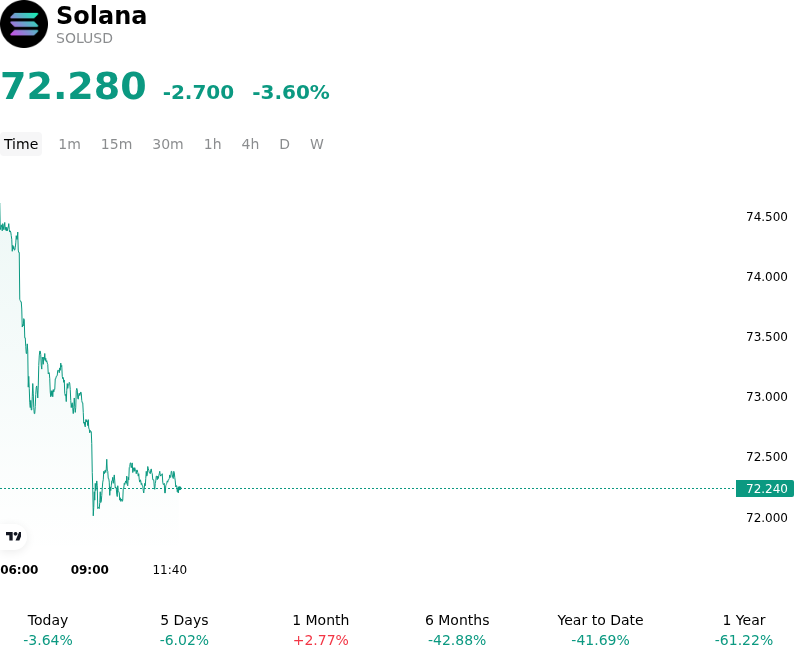
What is driving Solana (SOLUSD)’s stock price down today?
The retreat in Solana reflects a broader de-risking trend across high-beta digital assets as global macro conditions tighten. A primary driver appears to be the recent strength in the US dollar and a corresponding rise in the 10-year Treasury yield, which has diminished the appeal of non-yielding speculative assets. In this environment, institutional investors are reassessing their exposure to the Solana ecosystem, particularly as expectations for Federal Reserve policy shifts have become more hawkish. This shift in liquidity conditions has created a challenging backdrop for tokens that rely on consistent capital inflows to sustain high valuation premiums.
Institutional demand through spot Solana ETFs has also shown signs of exhaustion, with recent data indicating a pivot toward net outflows. This suggests that the initial wave of institutional accumulation may be giving way to profit-taking or tactical rebalancing by asset managers. As these regulated investment vehicles now represent a significant bridge for traditional capital, any sustained reduction in net inflows directly impacts the spot price and limits the ability of the market to absorb selling pressure from large-scale validators or early investors.
On-chain metrics provide further context for the current downward pressure. A noticeable decline in active wallet addresses and transaction fees suggests a cooling in the speculative activity that previously propelled the network’s growth. While Solana remains a leader in high-throughput applications, a temporary lull in major protocol launches or a slowdown in decentralized exchange volumes has reduced the organic demand for SOL required for network operations. This reduction in utility-driven demand, combined with a lack of immediate catalysts from the development roadmap, has left the price vulnerable to broader market volatility.
The intraday volatility was further exacerbated by positioning in the derivatives market. Elevated open interest in long perpetual futures contracts created a fragile market structure, leading to a cascade of liquidations once the price breached key technical support levels. This deleveraging event forced automated selling, which deepened the correction despite the lack of a singular catastrophic fundamental trigger. Furthermore, regulatory uncertainty regarding the evolving classification of Layer-1 assets continues to linger, prompting some institutional desks to reduce their concentration in the asset during periods of heightened macro uncertainty.
Technical Analysis of Solana (SOLUSD)
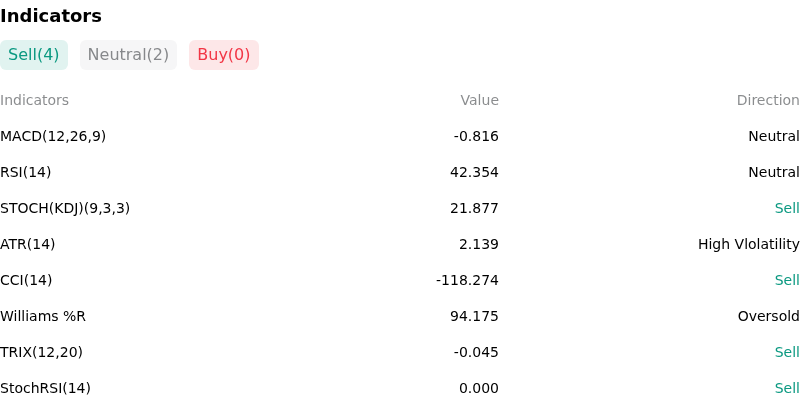
Technically, Solana (SOLUSD) shows a MACD (12,26,9) value of -0.800, indicating a neutral signal. The RSI at 42.619 suggests neutral condition and the Williams %R at 92.233 suggests oversold condition. Please monitor closely.
More details about Solana (SOLUSD)
Recent Events and Risks:
- Regulatory and ETF Uncertainty: The lack of immediate progress regarding a spot Solana ETF, combined with the SEC’s persistent classification of SOL as a security in ongoing litigation against major exchanges, creates a significant valuation ceiling and discourages conservative institutional allocation compared to Bitcoin or Ethereum.
- Leverage-Induced Liquidation Risk: A recent buildup in Solana futures Open Interest (OI) has increased the asset’s vulnerability to a liquidation cascade. Because SOL exhibits high beta relative to the broader market, any sharp decline in Bitcoin prices could trigger a forced unwind of leveraged long positions, resulting in disproportionate intraday price drops.
- Network Reliability Concerns: Despite recent protocol upgrades aimed at mitigating congestion, the surge in high-frequency trading and meme coin issuance continues to test the network’s limits. Potential transaction failures or latency issues during periods of peak volatility remain a structural risk that can drive users toward alternative Layer-1 ecosystems.
- On-Chain Supply Pressure: Recent movements of large SOL tranches from dormant "whale" wallets to centralized exchange deposit addresses suggest increased intent for profit-taking or hedging. This increase in exchange reserves creates immediate overhead resistance and heightens the risk of a sharp sell-off if market sentiment shifts.
Recommended Articles


