


Solana (SOLUSD) Is up 1.15% on Jul 21: Why It Happened
Solana (SOLUSD) is up 1.15% at Jul 21 02:40(ET), now at $77.76, with a 7-day up of 2.07%.
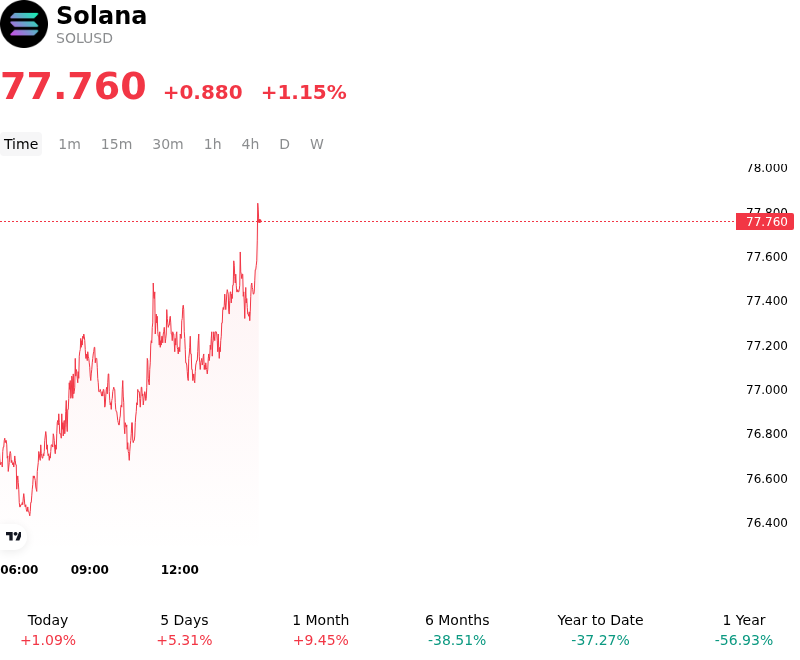
What is driving Solana (SOLUSD)’s stock price up today?
The upward movement in Solana is primarily driven by sustained institutional accumulation through spot-based investment vehicles and a notable expansion in on-chain liquidity. Market participants are increasingly pricing in the successful scaling milestones achieved by the network, particularly the full integration of high-performance validator clients which have solidified Solana's position as the leading blockchain for high-frequency decentralized finance and institutional payments. This fundamental strengthening has led to a re-rating of the asset relative to other Layer-1 platforms, attracting capital from diversified digital asset funds seeking exposure to network utility.
Macroeconomic conditions have provided a supportive backdrop for this price action. A stabilization in U.S. Treasury yields and a softening of the U.S. Dollar Index have enhanced the appeal of high-beta digital assets. As global liquidity conditions show signs of improvement, Solana has benefited from its status as a primary beneficiary of risk-on sentiment within the crypto-native ecosystem. The intraday volatility reflects a tug-of-war between profit-taking at key psychological resistance levels and aggressive dip-buying by institutional desks capitalizing on the asset's relative strength.
On-chain metrics indicate a surge in stablecoin velocity and decentralized exchange volume, suggesting that the price appreciation is backed by organic network demand rather than purely speculative leverage. The growth of the Decentralized Physical Infrastructure (DePIN) sector on the Solana network has also introduced a new cohort of non-speculative users, creating a floor for capital flows. This structural shift in the user base reduces the reliance on retail momentum and aligns the asset more closely with broader technology and infrastructure investment cycles.
In the derivatives market, the session was characterized by a squeeze of short positions as the asset broke through technical clusters. Open interest has remained robust, indicating that the move is supported by fresh capital entering the market rather than simple short-covering. However, investors remain mindful of regulatory developments surrounding the classification of ecosystem-native tokens, which continues to be a primary source of tail risk. For now, the combination of technological maturity and increasing institutional accessibility remains the dominant driver of Solana's market performance.
Technical Analysis of Solana (SOLUSD)
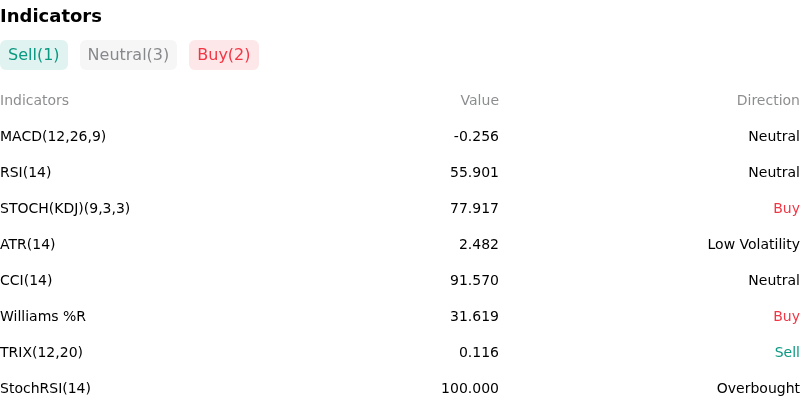
Technically, Solana (SOLUSD) shows a MACD (12,26,9) value of -0.256, indicating a neutral signal. The RSI at 55.901 suggests neutral condition and the Williams %R at 31.619 suggests buy condition. Please monitor closely.
More details about Solana (SOLUSD)
Recent Events and Risks:
- Security and Protocol Exploits: Within the last 24 hours, the Solana ecosystem has faced severe security breaches, including a $20 million drain from BonkDAO via a governance-based attack and a $1.1 million liquidity exploit on Allbridge Core, significantly undermining investor confidence in the network's decentralized finance protocols.
- Technical Breakdown and Liquidation Risk: SOL price action has stalled following a sharp rejection at the $80 psychological resistance, resulting in a cascade of leveraged long liquidations and a shift in market structure that threatens a breakdown toward the $69.60–$73 support cluster.
- Macro-Driven Capital Outflows: A systemic sell-off in global technology equities, characterized by heavy losses in the Nasdaq 100 and Nikkei 225, has triggered a flight to safety, disproportionately impacting high-beta assets like Solana as institutional traders reduce exposure amid rising Treasury yields.
- Diminishing On-Chain Utility: Recent degraded performance reports from the Phantom wallet and a cooling of the speculative memecoin activity on platforms such as Pump.fun have led to a noticeable decline in network fee generation and active user addresses, removing a primary catalyst for immediate price recovery.
Recommended Articles


