


Solana (SOLUSD) Is down 1.24% on Jul 17: What Are the Risk Factors?
Solana (SOLUSD) is down 1.24% at Jul 17 00:20(ET), now at $73.87, with a 7-day down of 3.76%.
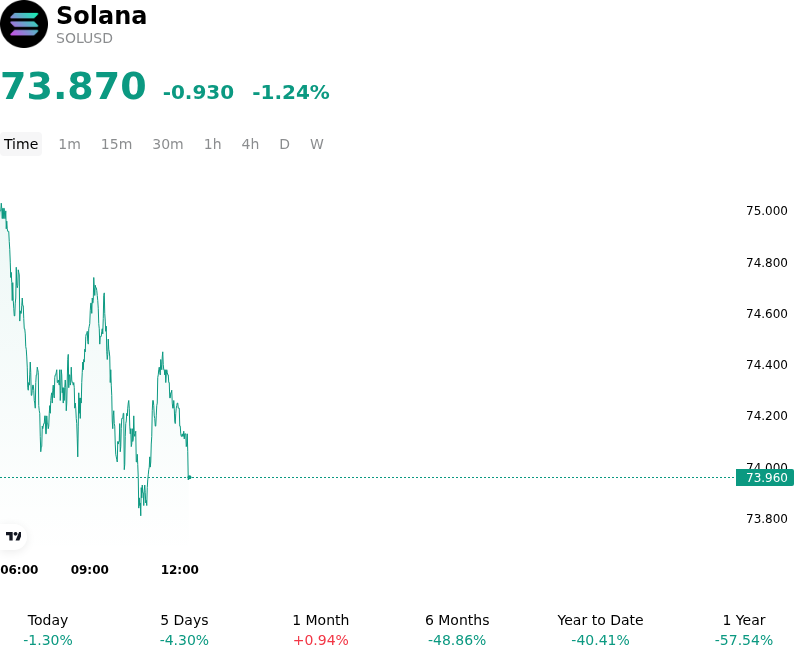
What is driving Solana (SOLUSD)’s stock price down today?
The intraday weakness in Solana reflects a broader cooling of risk appetite across the digital asset landscape, largely driven by a repricing of global liquidity conditions. As US Treasury yields showed signs of firming following recent economic data, the relative attractiveness of non-yielding high-beta assets faced immediate pressure. This macro-driven rotation prompted a tactical reduction in exposure among institutional desks that have increasingly integrated Solana into their systematic portfolios.
Specific to the Solana ecosystem, the price action suggests a temporary exhaustion of the recent momentum that had been fueled by high expectations for network throughput milestones and the continued expansion of its decentralized physical infrastructure projects. With the market transitioning into a period of data-driven assessment, investors are closely monitoring whether on-chain activity and decentralized finance volumes can sustain their current trajectory. The absence of a fresh catalyst to drive spot demand has allowed short-term speculators to dictate the direction of the session, resulting in a modest retracement as the asset tests psychological support levels.
Derivatives market positioning further exacerbated the downward move. A buildup of long-side leverage in perpetual swap contracts over the preceding sessions created a fragile liquidity environment. As spot prices began to drift lower, the resulting liquidation of overextended positions accelerated the decline, a common characteristic of Solana’s high-velocity trading profile. This deleveraging event appears more technical than fundamental, reflecting a washout of retail sentiment rather than a shift in the long-term structural thesis for the network.
Institutional flows through regulated investment vehicles also appeared to reach a point of temporary saturation. After several weeks of consistent inflows into Solana-based products, the current session saw a shift toward neutral or slightly negative net flows, suggesting that large-scale allocators are opting for a wait-and-see approach. This pause in institutional accumulation often precedes a period of consolidation, as the market digests recent gains and reassesses the regulatory environment surrounding decentralized infrastructure and validator decentralization.
Looking ahead, the primary risks remain tied to broader monetary policy and the potential for further volatility in the traditional fixed-income markets. While Solana continues to capture significant market share in terms of active addresses and transaction count, its sensitivity to US dollar strength and global liquidity cycles remains a dominant factor in its intraday performance. Investors are currently prioritizing capital preservation while watching for signs of a stabilization in the underlying macro environment before re-entering aggressive long positions.
Technical Analysis of Solana (SOLUSD)
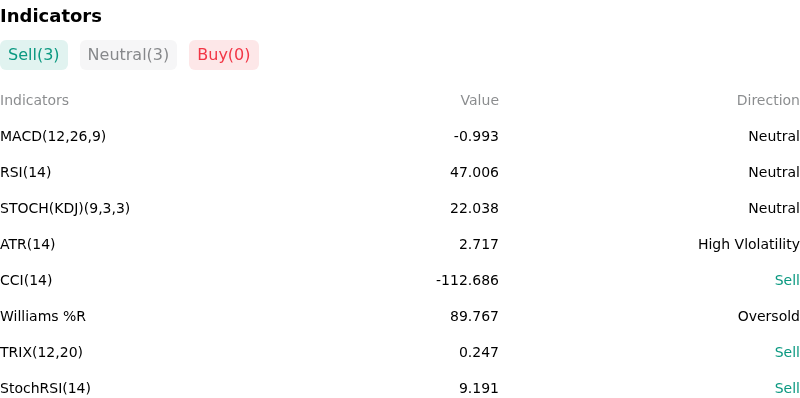
Technically, Solana (SOLUSD) shows a MACD (12,26,9) value of -0.993, indicating a neutral signal. The RSI at 47.006 suggests neutral condition and the Williams %R at 89.767 suggests oversold condition. Please monitor closely.
More details about Solana (SOLUSD)
Recent Events and Risks:
- ETF Regulatory Divergence: While Ethereum has seen progress toward spot ETF approval, Solana remains at high risk of being classified as an unregistered security by the SEC in ongoing exchange litigations, potentially excluding it from the next wave of institutional wrapper products and creating a valuation disconnect.
- Meme Coin Liquidity Exhaustion: Solana’s recent transactional volume has been heavily dependent on speculative meme coin activity; a cooling of retail sentiment or a migration of "degen" capital to competing Layer-2 networks poses a threat to on-chain fee generation and localized demand for SOL.
- Leverage and Liquidation Clusters: Recent price volatility has led to a build-up of leveraged long positions in the perpetual futures market; a failure to hold psychological support levels near $160 could trigger a concentrated liquidation cascade, exacerbated by current thinning order book depth.
- FTX Estate Supply Overhang: Market participants remain wary of periodic liquidations from the FTX/Alameda bankruptcy estate, as the movement of staked SOL into liquid wallets for potential OTC or open-market sales continues to exert a persistent "supply overhang" on mid-term price recovery.
Recommended Articles


