

Ge Vernova Inc Stock (GEV) Moved Down by 7.13% on Mar 27: What Signal Does It Send?
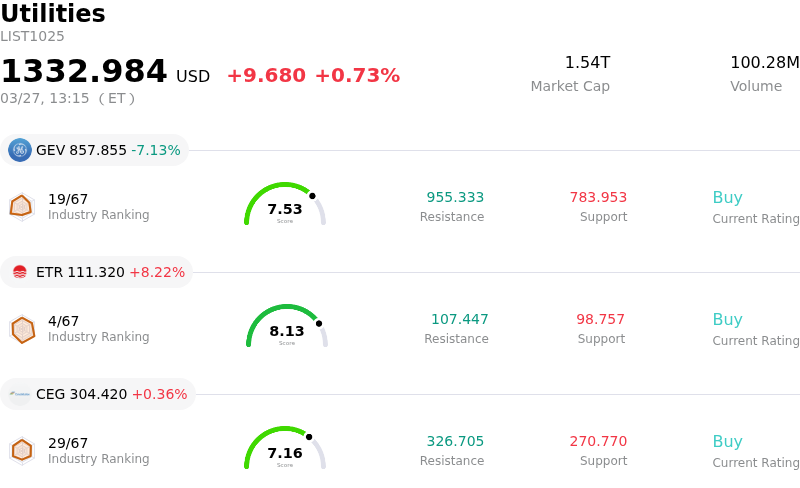
Ge Vernova Inc (GEV) moved down by 7.13%. The Utilities sector is up by 0.73%. The company underperformed the industry. Top 3 stocks by turnover in the sector: Ge Vernova Inc (GEV) down 7.13%; Entergy Corp (ETR) up 8.22%; Constellation Energy Corp (CEG) up 0.36%.
What is driving Ge Vernova Inc (GEV)’s stock price down today?
GE Vernova experienced a significant negative price movement today, largely attributed to market participants engaging in profit-taking following a substantial rally. The stock had seen considerable appreciation in the days leading up to today, partly driven by its recent inclusion in the S&P 100 index, which became effective earlier this week. This index inclusion typically triggers buying activity from passive and benchmarked funds, leading to upward price pressure.
Moreover, the company has been the subject of numerous positive analyst commentaries, with several firms reiterating "Buy" or "Strong Buy" ratings and raising price targets. These positive outlooks were fueled by strong demand for gas turbines, a growing backlog, and the company's strategic positioning within the expanding energy needs of AI and data centers. GEV also reported strong fourth-quarter earnings in late January, significantly beating analyst expectations for both earnings per share and revenue, and subsequently raised its full-year 2026 guidance.
Despite these strong fundamentals and bullish sentiment, some market data points to potential overvaluation concerns after the stock's impressive performance over the past year. The current price decline appears to be a natural cooling-off period, as investors reassess the stock's valuation after a period of rapid gains, rather than a reaction to specific negative news released today. While some institutional investors adjusted their holdings, this overall context suggests a market correction as investors realize gains from the recent uptrend.
Technical Analysis of Ge Vernova Inc (GEV)
Technically, Ge Vernova Inc (GEV) shows a MACD (12,26,9) value of [22.46], indicating a buy signal. The RSI at 55.43 suggests neutral condition and the Williams %R at -43.91 suggests oversold condition. Please monitor closely.
Fundamental Analysis of Ge Vernova Inc (GEV)
Ge Vernova Inc (GEV) is in the Utilities industry. Its latest annual revenue is $38.07B, ranking 2 in the industry. The net profit is $4.88B, ranking 4 in the industry. Company Profile
Over the past month, multiple analysts have rated the company as Buy, with an average price target of $872.76, a high of $1100.00, and a low of $424.45.
More details about Ge Vernova Inc (GEV)
Company Specific Risks:
- Persistent operational challenges within the Wind segment, including potential losses and difficulties in restructuring execution, pose a risk to the company's margins and earnings stability.
- The stock's premium valuation and current trading levels are considered overvalued, indicating a potential for price correction if high growth expectations are not met.
- Increased competition in the turbine market is leading to concerns over pricing power for new bookings, which could negatively impact profitability.
- Recent insider selling activity, including a $3.48 million sale on February 26th and other proposed sales in early March, may signal reduced confidence and contribute to negative market sentiment.
Recommended Articles


