Bitcoin Price Forecast: BTC extends gains after third consecutive week of ETF inflows

Mitrade
coverImg
Source: DepositPhotos
  • Bitcoin price extends gains on Monday after breaking above the upper consolidation range it had been trading since early February.

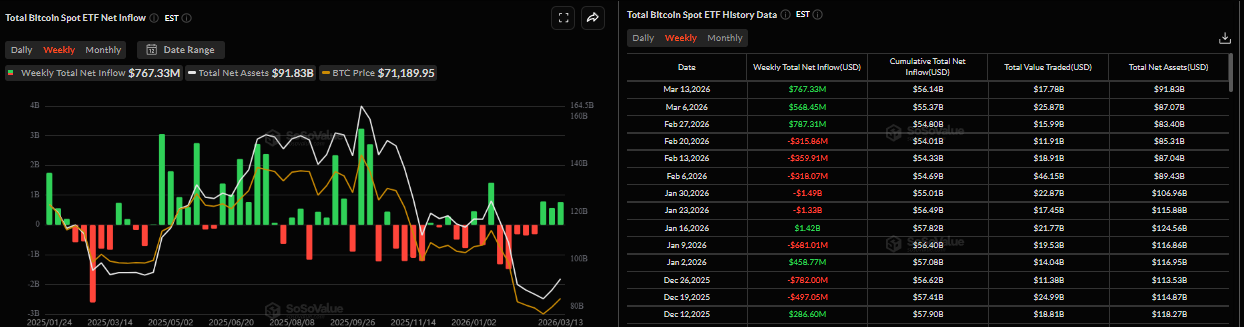
  • US-listed spot ETFs recorded an inflow of over $760 million last week, marking the third consecutive week of positive flows.

  • The technical outlook suggests an upside target above $78,000 following the confirmed bullish breakout.

Bitcoin (BTC) extends gains, trading above $73,000 at the time of writing on Monday, following a bullish breakout from the consolidation pattern it had been trading since roughly the past six weeks. Institutional demand supports the positive outlook, as spot Exchange Traded Funds (ETFs) recorded their third consecutive week of inflows despite markets being cautious due to the US-Israel war on Iran. With the breakout confirmed, the technical outlook suggests the Crypto King could hit the breakout target above $78,000 in the upcoming days.

Institutional demand remains robust

Institutional demand for Bitcoin remained strong last week, indicating growing investor confidence. According to SoSoValue data, spot Bitcoin ETFs recorded inflows of $767.33 million last week, following $568.45 million positive flows the previous one. This is the third consecutive week of inflows, and if these continue and intensify, BTC could see a rally in the upcoming weeks.
Bitcoin supply on exchanges falls to lowest level since 2017

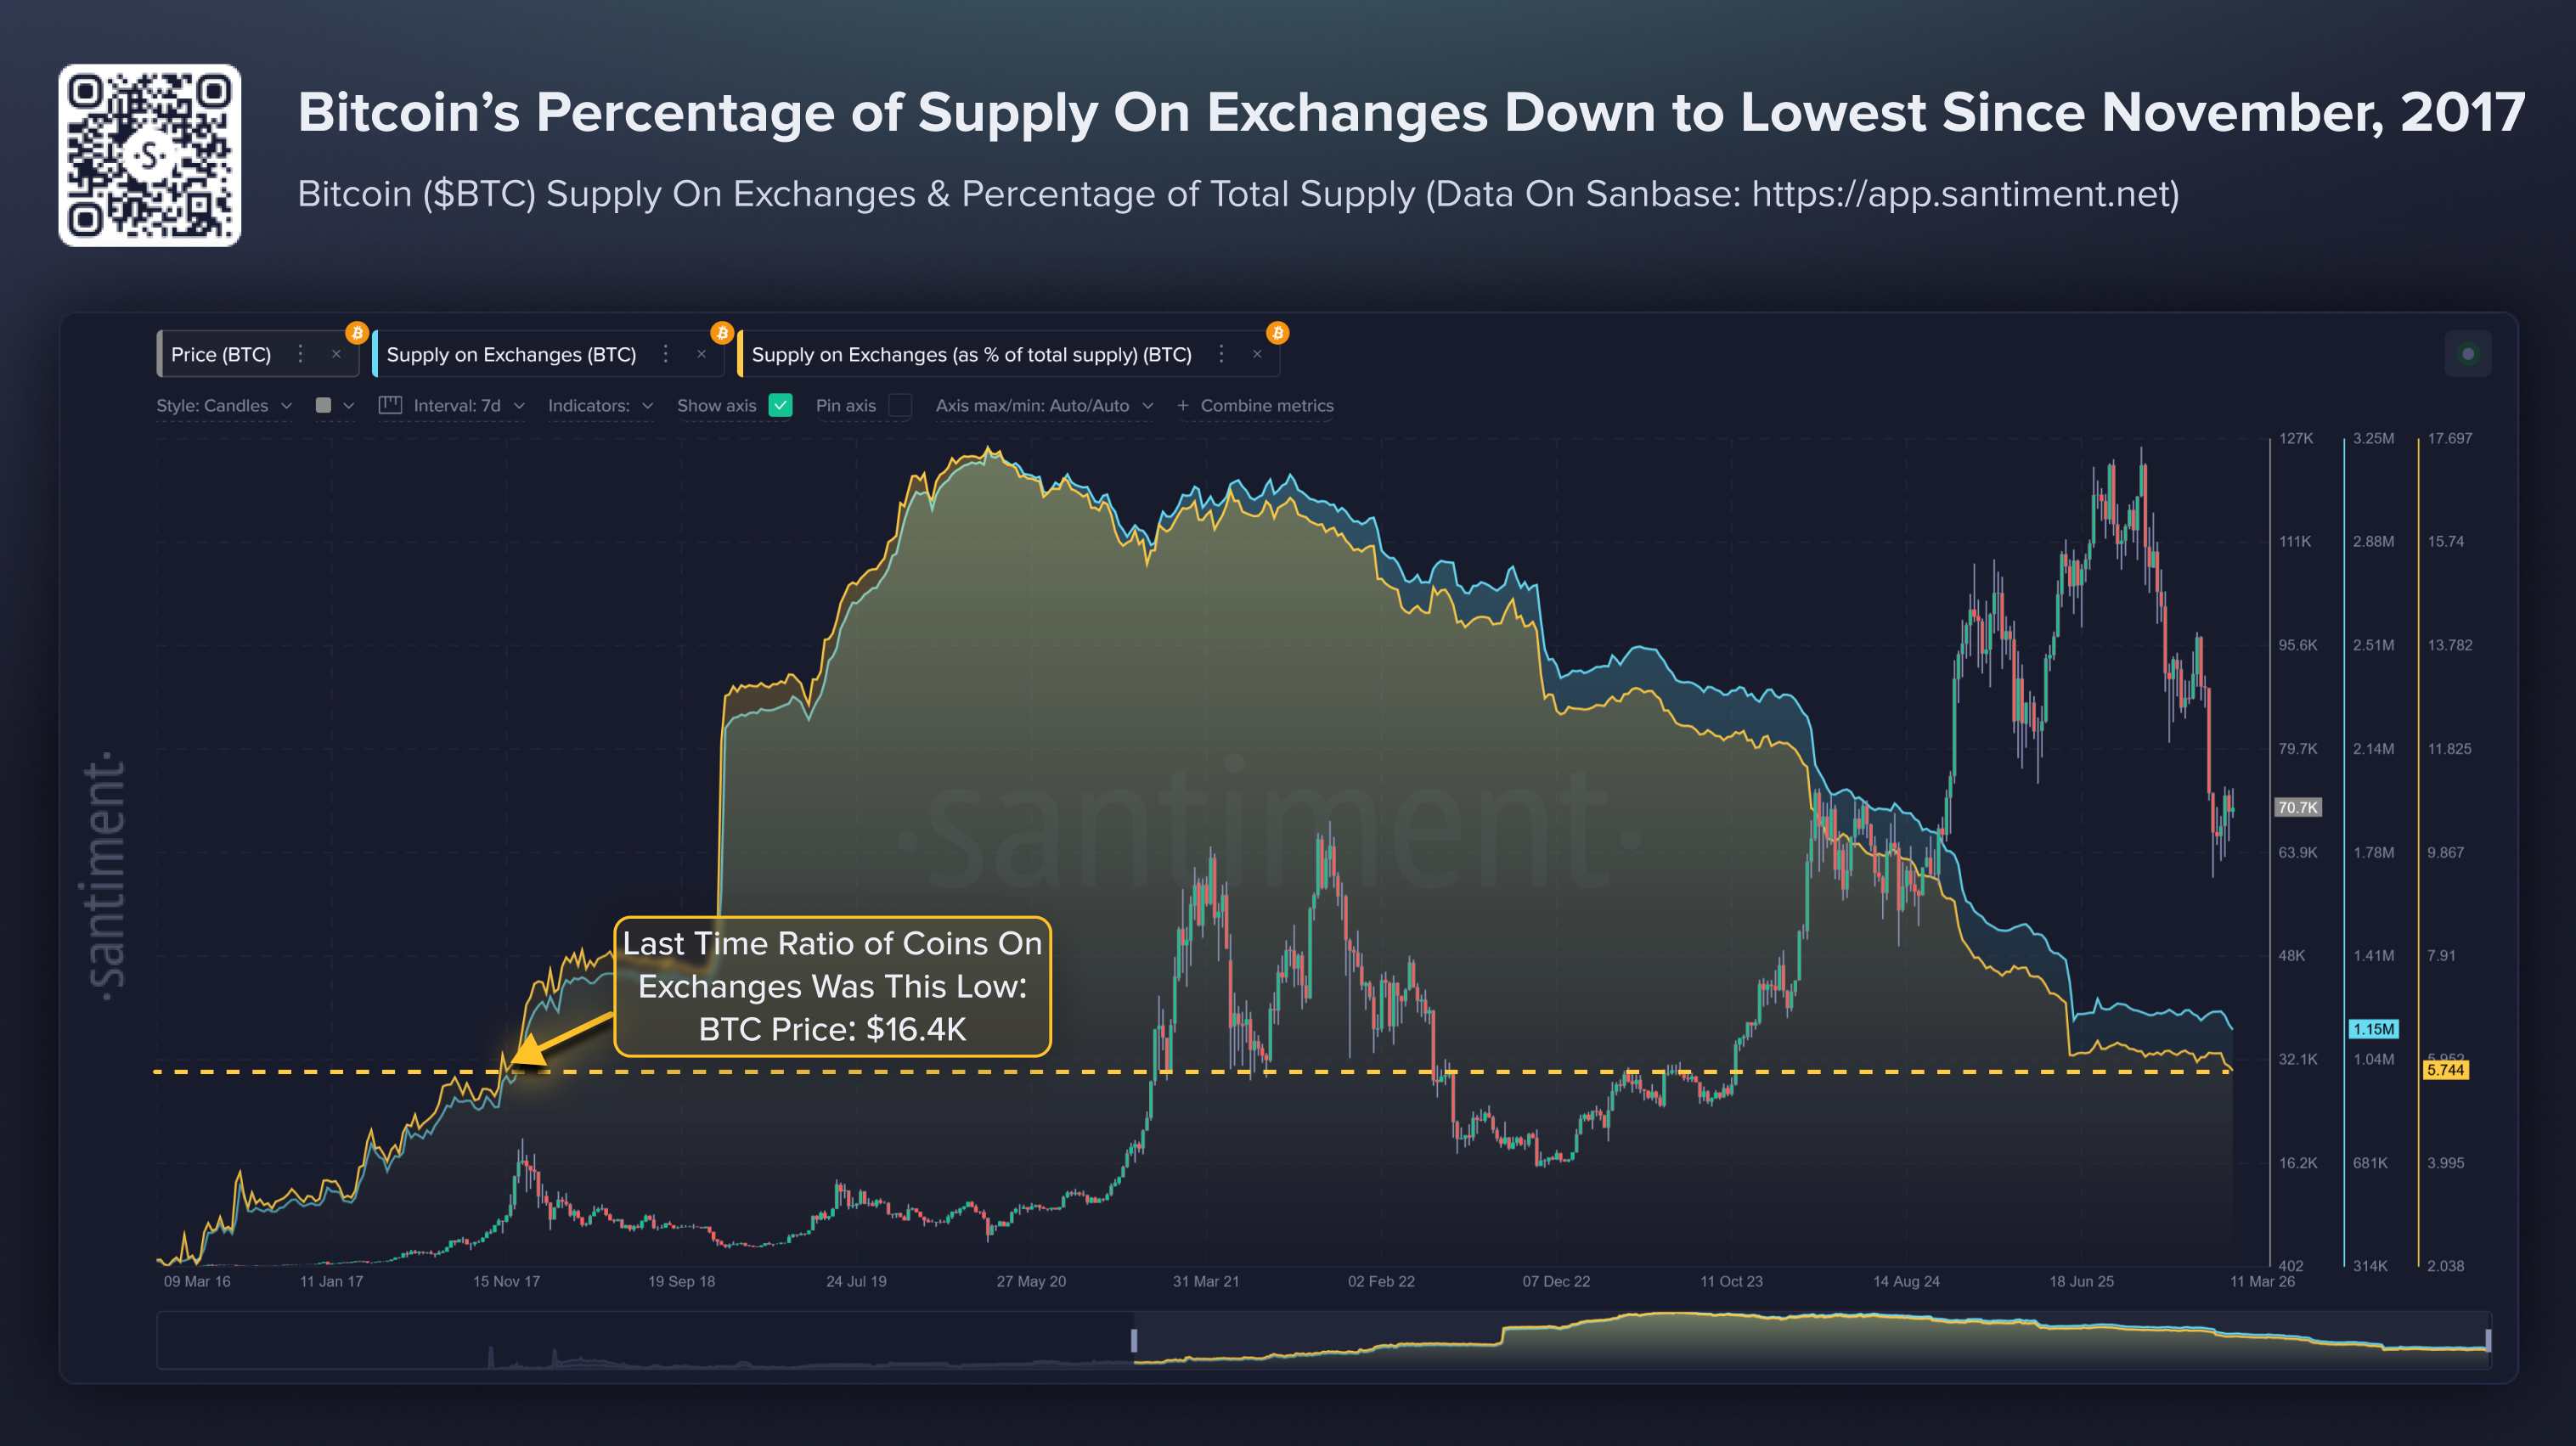
The Santiment chart below shows that the percentage of Bitcoin on exchanges has dropped to its lowest level since November 2017, suggesting fewer coins are available for sale. 

Generally, a falling exchange supply tends to support the bullish case for Bitcoin, as it signals reduced sell pressure. Any growing demand for BTC under these conditions can tighten the available market supply, potentially supporting higher prices.
Bitcoin Price Forecast: BTC bulls aiming for the $78,000 target

Bitcoin price is trading above $73,000 as of writing on Monday after surging over 10% in the previous week. The near-term tone turns cautiously bullish as price breaks above the parallel channel whose upper boundary sat near $72,600, signalling a challenge to the recent sequence of lower highs. This upside break unfolds as BTC pushes further above the 50-day Exponential Moving Average (EMA) around $72,800.

The Relative Strength Index (RSI) on the daily chart at 59 shows firm positive momentum without overbought conditions, and the Moving Average Convergence Divergence (MACD) line is holding above the signal line in positive territory, with a still-positive histogram, reinforcing the building upside pressure after the prior consolidation.

Initial support now aligns near the former channel top around $72,600, where a pullback would test the validity of the breakout, followed by a deeper cushion around $70,900, the last swing low before the latest thrust higher. Below that area, $68,800 emerges as stronger daily support, guarding the lower boundary of the previous range and the lower end of recent high-volume trade. 

On the topside, the technical target for the channel breakout is above $78,000, based on the channel’s distance. With a sustained close above this area, opening the way to near $80,000, it’s the 100-day EMA. A daily hold above $72,600 would keep the bullish bias intact, while a failure back inside the channel would reintroduce a more neutral, range-bound outlook.

(The technical analysis of this story was written with the help of an AI tool.)


Read more

  • Spot Gold Breaches Four Key Levels, Putting $3,500 at Risk as Technicals Enter Oversold Alert Zone
  • * The content presented above, whether from a third party or not, is considered as general advice only.  This article should not be construed as containing investment advice, investment recommendations, an offer of or solicitation for any transactions in financial instruments.

    goTop
    quote
    Related Articles
    placeholder
    Bitcoin Plunges 13% in a Week as Market Retreats to $60,000 LevelBitcoin plunged 13% over the past seven days as bullish defense lines crumbled in succession, officially kicking off the battle to defend the $60,000 mark.On November 16, following a viol
    Author  TradingKey
    Nov 16, Mon
    Bitcoin plunged 13% over the past seven days as bullish defense lines crumbled in succession, officially kicking off the battle to defend the $60,000 mark.On November 16, following a viol
    placeholder
    Bitcoin lost its 200-day average — but the exit started three sessions before the CPIBitcoin fell 2.5% to about $73,400 on 11 November, an 11-week low, breaking its 200-day moving average near $73,100. The 24-hour liquidation tally reached $632 to $705 million, roughly 82% of it longs. But spot ETF outflows began three sessions earlier and USDT's market cap has shrunk $6.6 billion in 60 days — the leveraged length left before the inflation print did. A double top at 81,890 and 81,080 leaves a measured target of 69,366.
    Author  Suzie
    Nov 11, Wed
    Bitcoin fell 2.5% to about $73,400 on 11 November, an 11-week low, breaking its 200-day moving average near $73,100. The 24-hour liquidation tally reached $632 to $705 million, roughly 82% of it longs. But spot ETF outflows began three sessions earlier and USDT's market cap has shrunk $6.6 billion in 60 days — the leveraged length left before the inflation print did. A double top at 81,890 and 81,080 leaves a measured target of 69,366.
    placeholder
    Bitcoin ETFs sold $1.28 billion in a week — and BTC is still above 75,000US spot Bitcoin ETFs logged $1.28 billion of net outflows in the week to Nov 6, the largest since late June, with BlackRock's IBIT accounting for $1.21 billion. Yet BTC only fell from $80,405 to $74,940, a 6.8% move. The gap between the fund flow and the price is the story: leveraged longs were flushed, but spot holders did not follow the ETFs out — and $75,000 is the line that decides whether that reading holds.
    Author  Suzie
    Nov 09, Mon
    US spot Bitcoin ETFs logged $1.28 billion of net outflows in the week to Nov 6, the largest since late June, with BlackRock's IBIT accounting for $1.21 billion. Yet BTC only fell from $80,405 to $74,940, a 6.8% move. The gap between the fund flow and the price is the story: leveraged longs were flushed, but spot holders did not follow the ETFs out — and $75,000 is the line that decides whether that reading holds.
    placeholder
    Binance replaced 95% of a $6.3bn hole — Bitcoin is trading the plumbing, not the coinBinance resumed withdrawals on November 1 after a record $6.3bn theft. In the first 9.5 hours, users withdrew $4.64bn and deposited $1.01bn, a net outflow of $3.64bn, or 2.1% of assets. Bitcoin fell to 76,173 and is now 78,473. The market is pricing the exchange, not the supply.
    Author  Suzie
    Nov 02, Mon
    Binance resumed withdrawals on November 1 after a record $6.3bn theft. In the first 9.5 hours, users withdrew $4.64bn and deposited $1.01bn, a net outflow of $3.64bn, or 2.1% of assets. Bitcoin fell to 76,173 and is now 78,473. The market is pricing the exchange, not the supply.
    placeholder
    Bitcoin is back above $80,000 — but 75% of the bounce was shorts, not buyersBitcoin trades at $80,669, back above the $80,000 line after touching $79,145 on October 24. But 75.4% of the last 24 hours of futures liquidations were shorts, CME open interest fell 36,545 BTC in October, and spot ETFs lost $773.5 million on October 22-23. Price is up; positioning is down. Here is why the bounce is a squeeze, and the four things that would make it real.
    Author  Suzie
    Oct 28, Wed
    Bitcoin trades at $80,669, back above the $80,000 line after touching $79,145 on October 24. But 75.4% of the last 24 hours of futures liquidations were shorts, CME open interest fell 36,545 BTC in October, and spot ETFs lost $773.5 million on October 22-23. Price is up; positioning is down. Here is why the bounce is a squeeze, and the four things that would make it real.
    Live Quotes
    Name / SymbolChart% Change / Price
    BTCUSD
    BTCUSD
    0.00%0.00
    ETHUSD
    ETHUSD
    0.00%0.00

    Bitcoin Related Articles

    • Bitcoin Leverage And Margin Trading in 2026: The Ultimate Beginner's Guide
    • Gold vs Bitcoin 2026: Which Is the Better Investment?Best Hedge Asset Comparison
    • Best Strategies When BTC Price Drops: From Hedging to Accumulating
    • How to Day Trade Crypto? Simplest Day Trading Strategy Ever
    • Bitcoin Price Prediction 2026-2030: Long-Term Outlook Driven by Data & Macro Cycles
    • Bitcoin Mining Beginner Guide: What Is Bitcoin Mining and How to Mine Bitcoin?

    Click to view more