

AUD/USD posts gain, yet dive below 0.6500 amid Aussie CPI, ahead of US GDP

■AUD/USD retreats from a peak of 0.6529 following an unexpected surge in Australian inflation figures.
■The US Dollar Index edges higher, influenced by solid US economic indicators and investor caution ahead of key GDP report.
■Despite a strong Q1 inflation report suggesting robust Australian economic activity, expectations for an RBA rate cut linger among analysts.
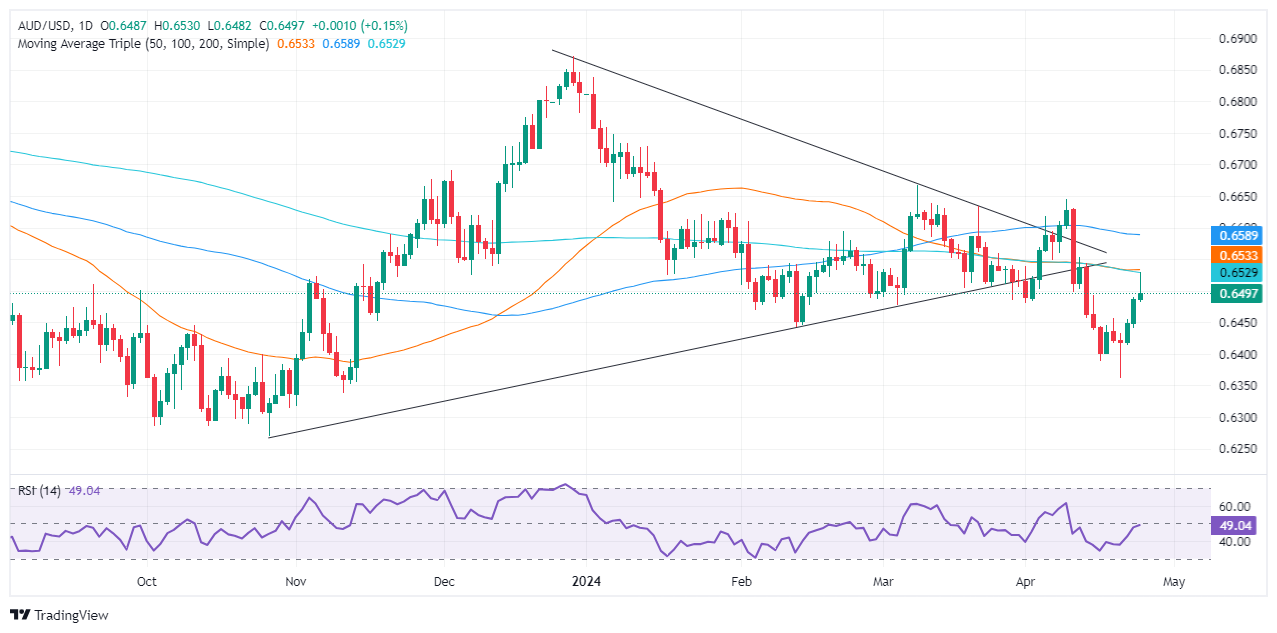
The Aussie Dollar finished Wednesday’s session with decent gains of 0.15% against the US Dollar, yet it retreated from weekly highs of 0.6529, which it hit after a hotter-than-expected inflation report. Economic data from the United States (US) boosted the Greenback, which, according to the US Dollar Index (DXY), gained 0.13%, up to 105.82. As the Asian session begins, the AUD/USD trades at 0.6495. down 0.02%.
AUD/USD retreats below 0.6500 amid strong US data
Wall Street was mixed on Wednesday after META reported earnings, which were better than expected but weighed on the US equity markets. Investors remain cautious ahead of the release of the US Gross Domestic Product (GDP) report on Thursday, which is expected to show the largest economy in the world grew 2.5% QoQ in the first quarter this year. At the same time, Initial Jobless Claims are expected to increase from 212K to 214K.
Aside from this, past data revealed on Wednesday suggested the US economy remains solid. Mach’s Durable Goods Orders increased 2.6% MoM, up from a 0.7% rise previously and surpassing 2.5% estimates. Core goods, which excluded transportation, increased by 0.2% MoM, an improvement over February's 0.1% increase but falling short of the 0.3% projected.
On Wednesday, during the Asian session, Australia’s Bureau of Statistics (ABS) revealed that inflation for Q1 2024 exceeded estimates by far of 0.6%, increasing QoQ by 1%. Annually based, the Consumer Price Index (CPI) expanded 3.6% YoY, down from 4.1% but above projections of 3.4%.
Traders sent the AUD/USD rallying above 0.6500 as they priced out a rate cut by the Reserve Bank of Australia (RBA) in 2024. Despite this red-hot report, ANZ Bank analysts expect the RBA to cut rates in November.
They added, "We think the RBA will want to see a couple of quarters of lower non-tradables and services inflation to be convinced that overall inflation will not only return to the 2–3% target band but remain there.”
AUD/USD Price Analysis: Technical outlook
Given the fundamental backdrop, the AUD/USD rallied toward the confluence of the 200 and 50-day moving averages (DMAs), though buyers lacked the strength to pierce that strong resistance level at 0.6526/32, retreating sharply back below the 0.6500 mark. That said, if the pair drops below the April 24 low of 0.6483, the AUD/USD could dive toward the February 13 low at 0.6442. Once cleared, up next would be 0.6400.
* The content presented above, whether from a third party or not, is considered as general advice only. This article should not be construed as containing investment advice, investment recommendations, an offer of or solicitation for any transactions in financial instruments.

