

Dow Jones Industrial Average climbs over 400 points on volatile NFP Friday
- Dow Jones gains 400-plus points as investors raise bets on rate cuts.
- US data broadly softer on key labor print.
- Tech stocks dragging Dow Jones higher.
The Dow Jones Industrial Average (DJIA) climbed 1.15% on Friday after a broad miss from US Nonfarm Payrolls (NFP) and other key labor data revealed a steep weakening in the US domestic economy, sparking increased bets of rate cuts from the Federal Reserve. The US added fewer jobs than expected in April, and the Unemployment Rate ticked higher. The ISM Services Purchasing Managers Index (PMI) also fell to a 16-month low as economic activity confirms a steepening economic slowdown.
Markets are counter-intuitively betting against the US economy, bidding equities broadly higher as economic data begins to deteriorate. According to the CME’s FedWatch Tool, rate markets now see a 64% chance of at least a quarter-point rate cut at the Fed’s September meeting.
Softer jobs and wages figures boost rate cut hopes
April’s NFP labor report showed the US added 175K net new jobs over the month, below the forecast 243K. The previous month saw an upside revision to 315K from 303K. Average Hourly Earnings in April grew by 0.2% MoM, below the expected 0.3%. ISM Services PMI unexpectedly fell to a 16-month low of 49.4, below the key contractionary 50.0 level and missing the forecast increase to 52.0 from 51.4.
The single thorn in the side of rate cut hopes came from ISM Services Prices Paid in April, which climbed back up to 59.2 from the previous 53.4 as inflationary pressures continue to plague the domestic US economy.
Dow Jones news
The Dow Jones climbed over 1% on Friday, dragged higher by a smattering of technology stocks while the downside remains relatively capped. Amgen Inc. (AMGN), a biotech firm, soared 12.5% on the day, gaining around 45 points to trade above $313.00 per share. Amgen was followed by Apple Inc. (AAPL), climbing 7% on Friday to gain 12 points and trade above $185.00 per share.
On the low side, Chevron Corp. (CVX) fell -1.12%, shedding -1.8 points and falling below $160.00 per share. McDonald’s Corp. (MCD) also shed -1.0% as forward guidance warns of declining sales. McDonald’s fell -1.0%, losing 3 points and trading into $270.00 per share.
Dow Jones technical outlook
The Dow Jones Industrial Average climbed to an early session high of 38,840.05 after markets drove higher on the US’ latest NFP labor print, gaining ground from the day’s early low bids of 38,345.60. Equities are trading into the top half of the day’s price action as the DJIA looks to wrap up Friday near 38,800.00.
Friday’s bullish momentum takes the Dow Jones back above the 50-day Exponential Moving Average (EMA) at 38,435.55. Long-term price action still rests in the hands of bulls as the DJIA trades north of the 200-day EMA at 36,800.58.
Dow Jones five-minute chart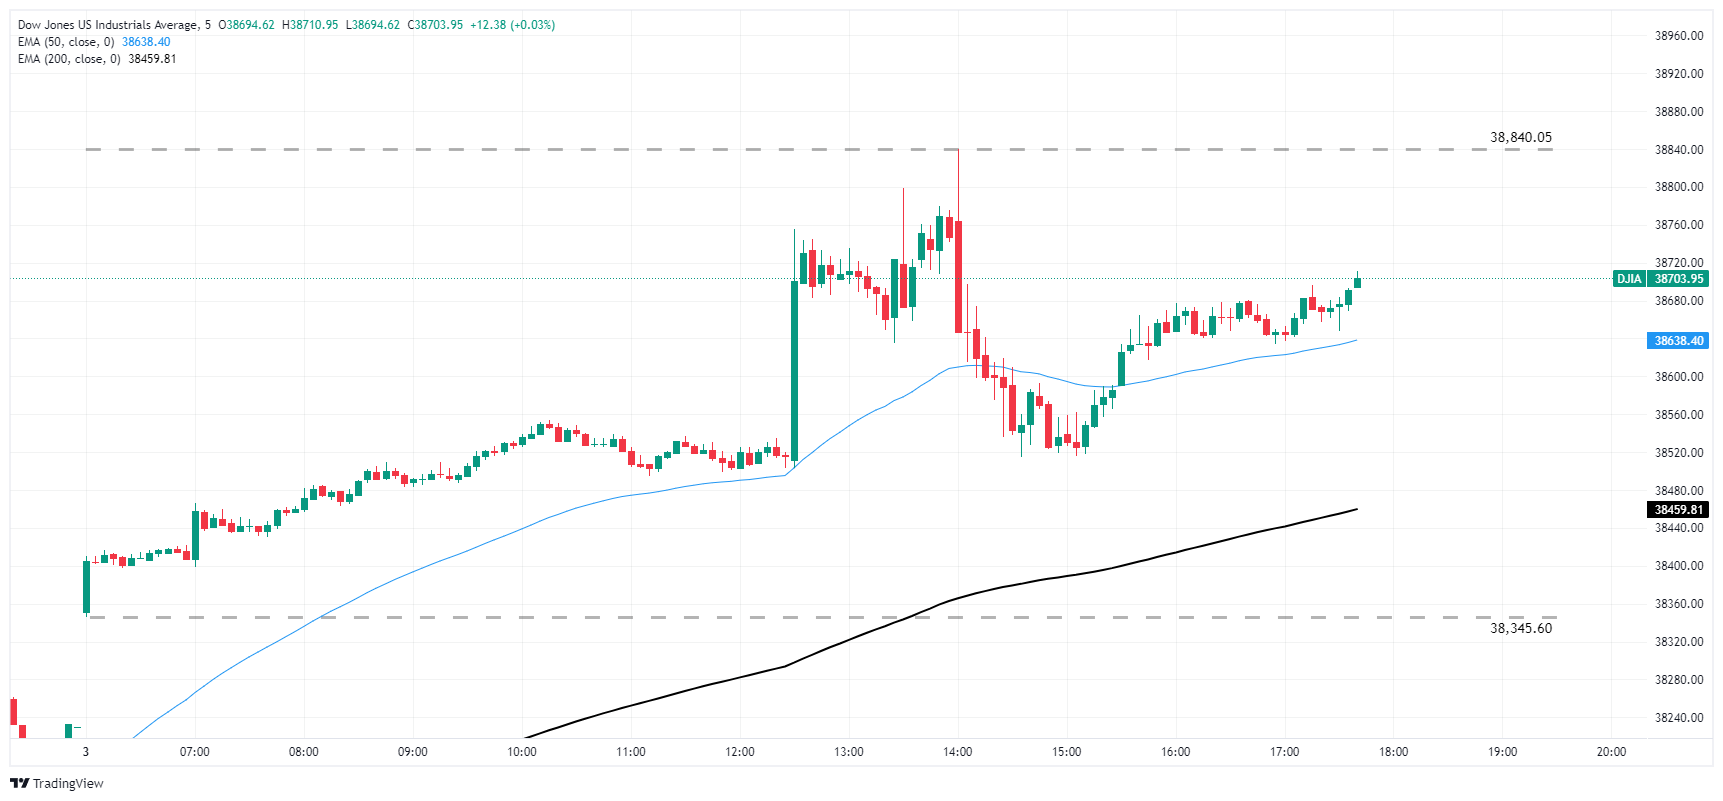
Dow Jones daily chart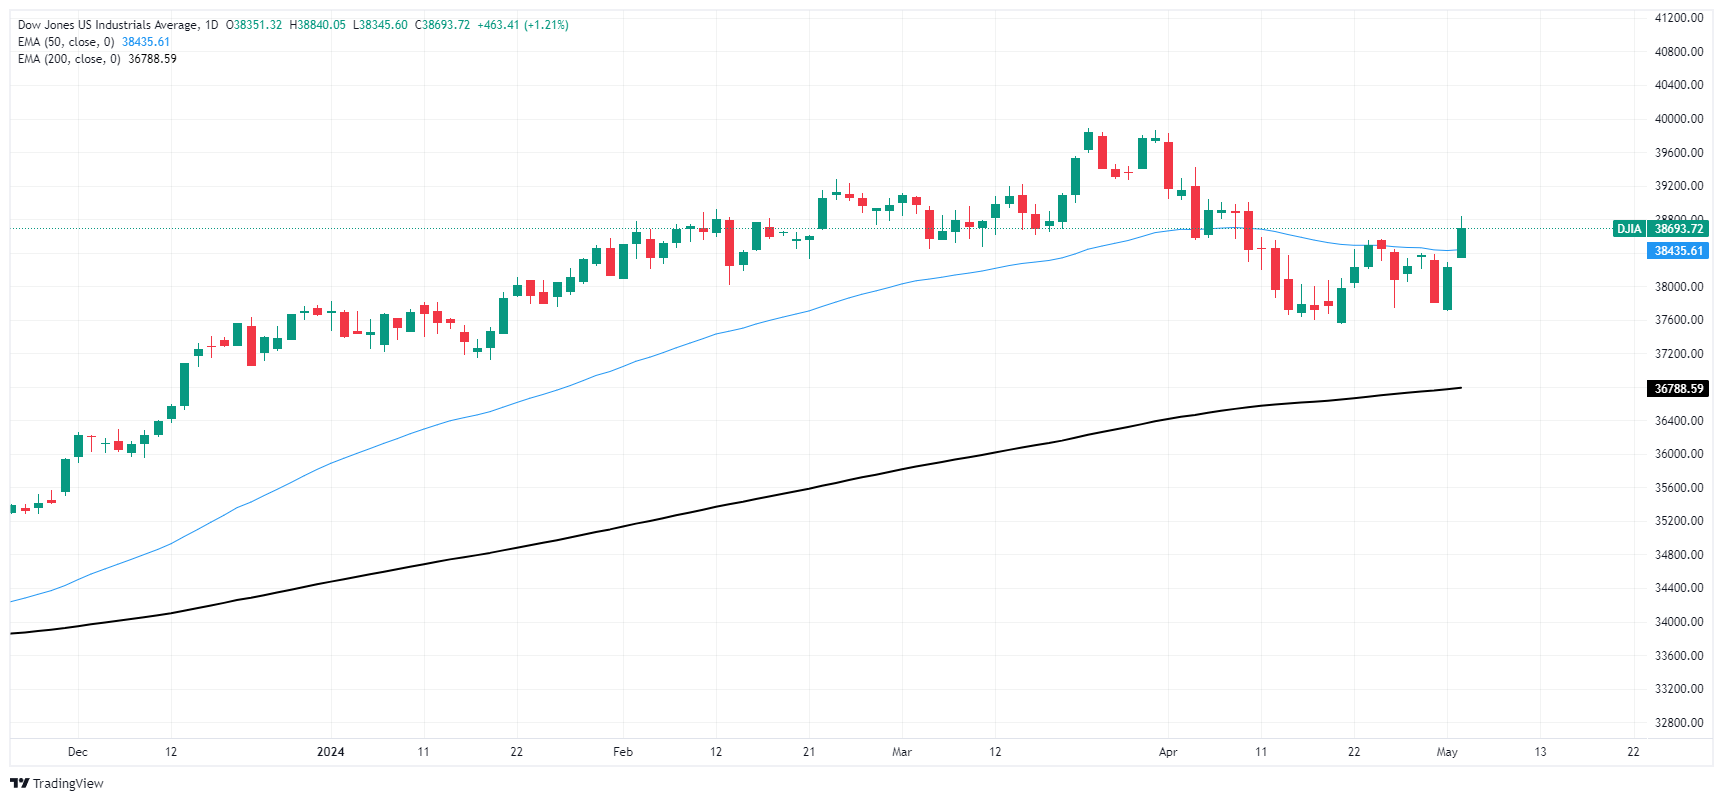
Dow Jones FAQs
The Dow Jones Industrial Average, one of the oldest stock market indices in the world, is compiled of the 30 most traded stocks in the US. The index is price-weighted rather than weighted by capitalization. It is calculated by summing the prices of the constituent stocks and dividing them by a factor, currently 0.152. The index was founded by Charles Dow, who also founded the Wall Street Journal. In later years it has been criticized for not being broadly representative enough because it only tracks 30 conglomerates, unlike broader indices such as the S&P 500.
Many different factors drive the Dow Jones Industrial Average (DJIA). The aggregate performance of the component companies revealed in quarterly company earnings reports is the main one. US and global macroeconomic data also contributes as it impacts on investor sentiment. The level of interest rates, set by the Federal Reserve (Fed), also influences the DJIA as it affects the cost of credit, on which many corporations are heavily reliant. Therefore, inflation can be a major driver as well as other metrics which impact the Fed decisions.
Dow Theory is a method for identifying the primary trend of the stock market developed by Charles Dow. A key step is to compare the direction of the Dow Jones Industrial Average (DJIA) and the Dow Jones Transportation Average (DJTA) and only follow trends where both are moving in the same direction. Volume is a confirmatory criteria. The theory uses elements of peak and trough analysis. Dow’s theory posits three trend phases: accumulation, when smart money starts buying or selling; public participation, when the wider public joins in; and distribution, when the smart money exits.
There are a number of ways to trade the DJIA. One is to use ETFs which allow investors to trade the DJIA as a single security, rather than having to buy shares in all 30 constituent companies. A leading example is the SPDR Dow Jones Industrial Average ETF (DIA). DJIA futures contracts enable traders to speculate on the future value of the index and Options provide the right, but not the obligation, to buy or sell the index at a predetermined price in the future. Mutual funds enable investors to buy a share of a diversified portfolio of DJIA stocks thus providing exposure to the overall index.
Recommended Articles


