

Top 3 Price Prediction Bitcoin, Ethereum, Ripple: Relief wave on altcoins likely as BTC shows a $5,000 range

- Gold Price Forecast: Gold Poised to Break $4,200 as Oil Price Slump Eases Inflation Fears
- Gold declines despite easing concerns over inflation, interest rate hikes
- Fed Decision Eve: 104 Economists Expect No Change; Why Is Citadel Securities Betting on a Surprise Hike?
- Gold Price Forecast: Can Gold Hold $4,020 as Fed Rate Hike Expectations Rise?
- Middle East War updates: US-Iran pause strikes as Trump weighs up diplomatic options
- WTI Oil flirts with the $80 level amid speculation about US-Iran peace talks

■Bitcoin price could drop into the liquidity pool between $60,600 and $59,005 as it establishes $65,600 as weekly resistance.
■Ethereum price could confirm a falling wedge pattern with a 25% run above $3,406 at breakout point.
■Ripple price defends $0.5000 but overhanging bearish activity will keep XRP holders’ vision for $0.6000 a hopium pipe dream.
Bitcoin (BTC) price has recorded lower highs over the past seven days, with a similar outlook witnessed among altcoins. Meanwhile, while altcoins display a rather disturbing outlook amid a broader market bleed, there could be some relief soon as fundamentals show:
A massive cool off in euphoria and sentiment
A cool-off phase allows the market to correct itself, stabilize, and establish a more sustainable growth trajectory.
A healthy outlook in funding rates
Healthy funding rates indicate a well-functioning and balanced market ecosystem, promoting stability, reducing the risk of manipulation, and fostering confidence among market participants.
Overleveraged short positions are waiting to get liquidated
While the initial liquidation of overleveraged short positions may lead to short-term volatility, the eventual impact can often be positive for the price of an asset.
Bitcoin price forms a $5,000 range
After successive weekly closes below $65,600, and with the bulls defending against a dip below $60,000, Bitcoin price has established a $5,000 macro market range. The odds hint at a further decline given the Relative Strength Index (RSI) is subdued below the mean level of 50 and the Awesome Oscillator (AO) indicator continues to post red histograms in negative territory.
If seller momentum increases and Bitcoin price dips into the liquidity pool between $60,600 and the intra-day low of March 5 at $59,005, the downtrend could continue with bulls waiting to buy BTC just above the $50,000 psychological level.
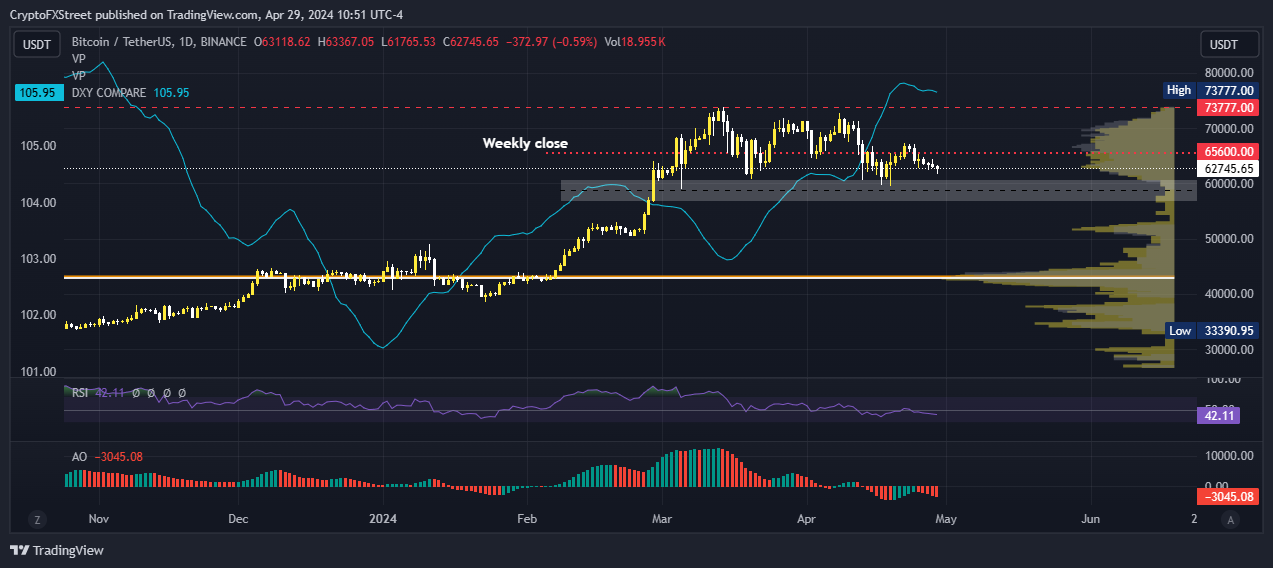
BTC/USDT 1-day chart
Conversely, if history repeats, Bitcoin price could move in the opposite direction as the DXY Compare indicator. To confirm the continuation of the uptrend, however, the bulls must haul BTC above $72,000 because plenty of bearish activity awaits BTC price near the $70,000 threshold.
Ethereum price could rally 25%, pending confirmation
Ethereum price is trading with a bearish bias, but not for long as the price action since March 12 has consolidated into a descending wedge pattern. The execution of this bullish reversal technical formation will happen after a decisive breakout above the upper trendline on the one-day timeframe.
The target objective for this pattern is a 25% move toward $4,250, determined by measuring the heath of the wedge and superimposing it at the expected breakout point.
The Relative Strength Index (RSI) continues to wind around the mean level of 50, while the AO indicator shows growing bullish sentiment displayed by the green histograms that draw toward positive territory.
The higher highs seen on the RSI chart since mid-April relative to the lower highs in ETH price also support the bullish thesis, suggesting a bullish divergence. If the RSI flips above the mean level, it would tilt the odds further in favor of a bullish breakout.
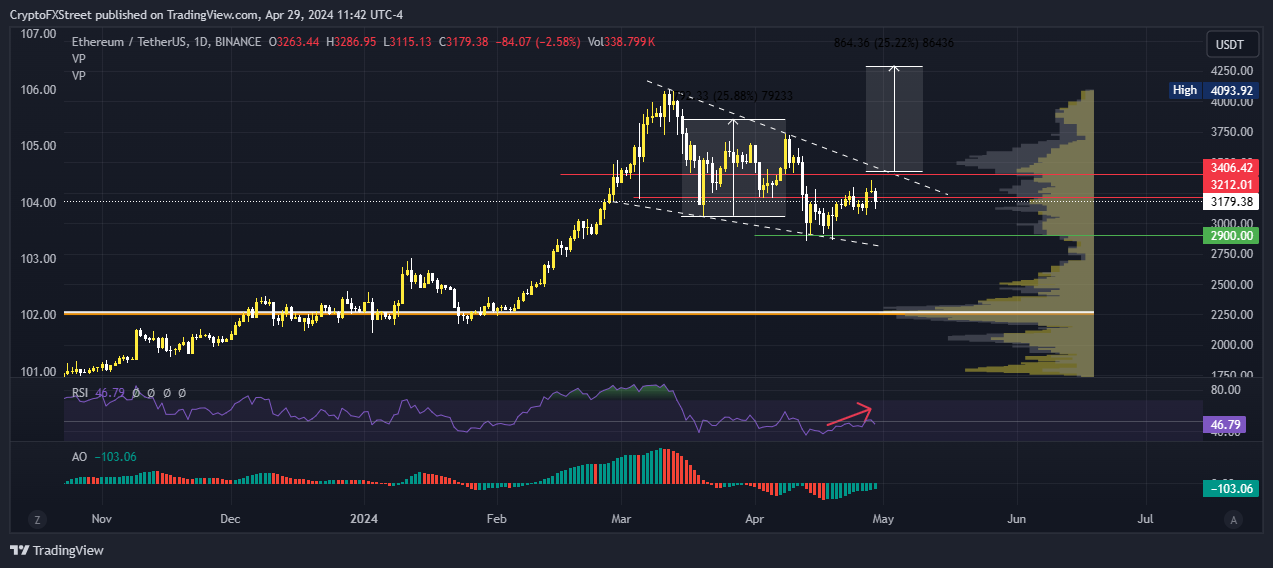
ETH/USDT 1-day chart
On the other hand, if ETH bears have their way and book profits for the nearly 10% gains made since Ethereum price bounced from the $2,900 support, the market would see a correction. A candlestick close below $2,900 would invalidate the bullish thesis.
Ripple price suffers the weight of overhanging bearish pressure
Ripple downside potential remains very much alive with bearish activity waiting to descend on XRP price once it lifts. This is seen with the multiple spikes on the volume profile (grey) in the one-day chart below. The RSI is also declining steadily, showing falling momentum.
This, coupled with the red histogram bars that remain in negative territory reinforce the bearish outlook. If the $0.5000 psychological support is lost, Ripple price could drop all the way to the $0.4500 threshold, or in a dire case, extend the fall to the bottom of the market range at $0.4188, nearly 20% below current levels.
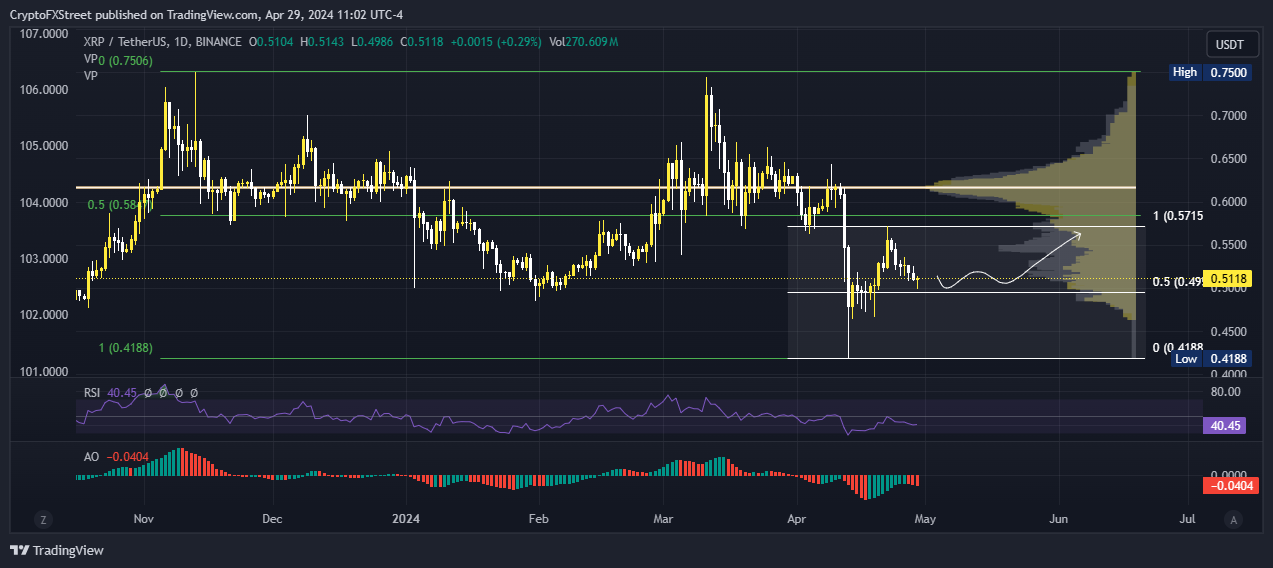
XRP/USDT 1-day chart
On the flip side, if XRP bulls show up, Ripple price could recover. For the bearish thesis to be invalidated, however, the price must record a candlestick close above $0.6500. This is because massive bearish activity awaits the payments token in the area surrounding $0.6000 as XRP bears wait to cash in.
Read more
* The content presented above, whether from a third party or not, is considered as general advice only. This article should not be construed as containing investment advice, investment recommendations, an offer of or solicitation for any transactions in financial instruments.


