

USD/JPY Price Forecast: Rising 20-day EMA suggests a strong upside trend

- Gold drops below $4,700 on stronger US Dollar, Middle East tensions
- Bitcoin Returns to $79,000 Level. Prediction Markets Bullish on Breaking $80,000 in April
- Gold holds steady near $4,600 as Fed rate decision looms
- Fed FOMC Meeting Is Approaching: Where Is the Focus? Will There Be More Rate Cuts This Year?
- Goldman Sachs: Structurally Bullish on Gold to $5,400, But Warns of Short-Term Pullback
- WTI sticks to modest gains above $94.00 as Hormuz standoff fuels supply concerns
USD/JPY edges lower to near 148.35 after a three-day winning spree.
The US-EU tariff deal has strengthened the US Dollar.
Investors await the Fed’s and the BoJ’s monetary policy this week.
The USD/JPY pair ticks down to near 148.35 during the late Asian trading session on Tuesday, struggling to extend its three-day winning streak. The outlook of the pair remains firm as the US Dollar (USD) demonstrates strength, following the announcement of a trade agreement between the United States (US) and the European Union (EU).
This weekend, officials from both sides of the Atlantic approved a tariff deal, which diminished fears of disruption in the global trade flow and the collapse of the US supply chain.
At the time of writing, the US Dollar Index (DXY), which tracks the Greenback’s value against six major currencies, holds onto gains near the weekly high around 98.67.
Meanwhile, investors await monetary policy announcements by the Federal Reserve (Fed) and the Bank of Japan (BoJ), which are scheduled for Wednesday and Thursday. Both central banks are expected to leave interest rates at their current levels.
In Tuesday’s session, investors will focus on the US JOLTS Job Openings data for June, which will be published at 14:00 GMT. Economists expect US companies to have posted 7.55 million jobs.
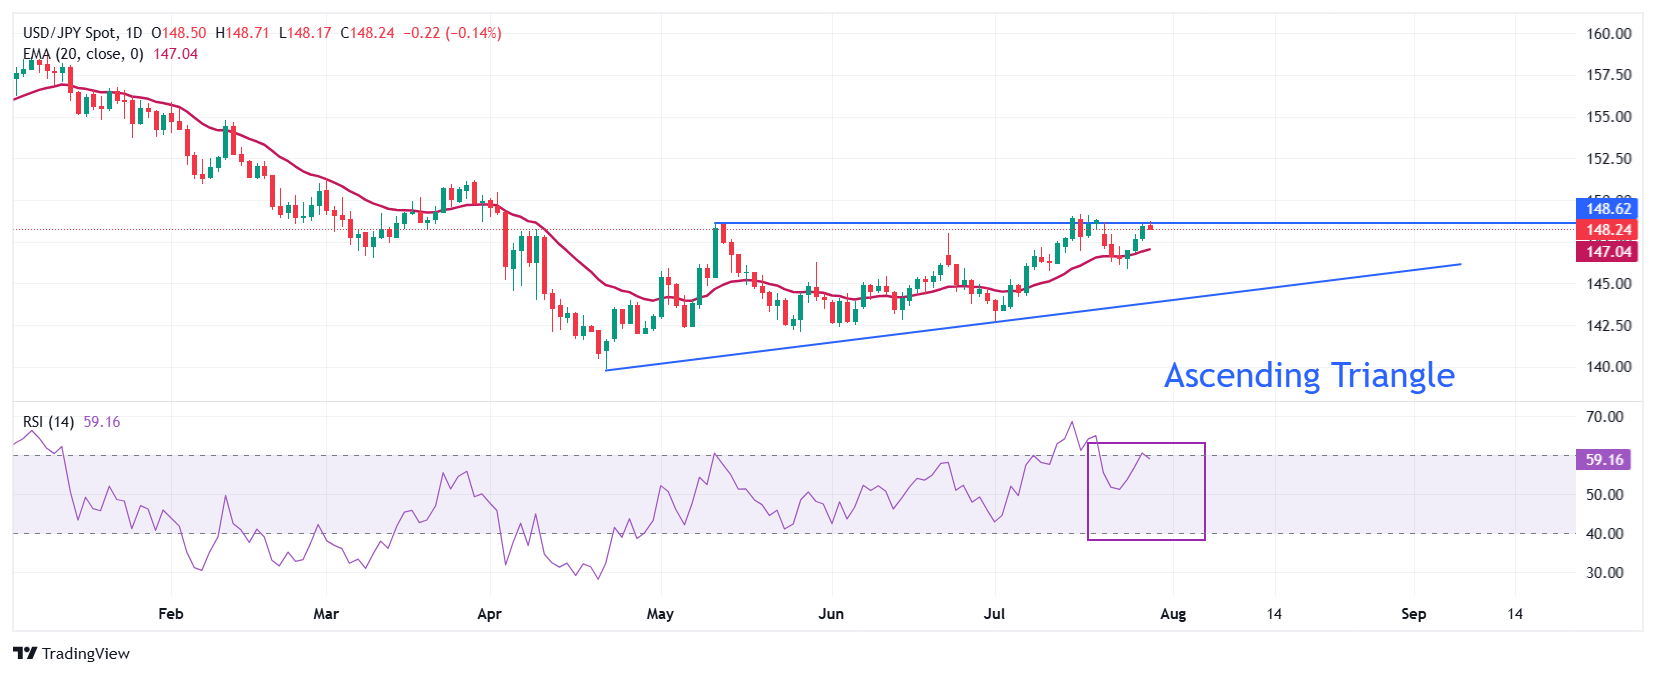
USD/JPY trades close to the horizontal resistance of the Ascending Triangle chart pattern around 148.60. The upward-sloping border of the above-mentioned pattern is plotted from the April low near 139.90. The 20-day Exponential Moving Average (EMA) slopes higher to near 147.04, indicating that the near-term trend is bullish.
The 14-day Relative Strength Index (RSI) strives to break above 60.00. A fresh bullish momentum would emerge if the RSI breaks above that level.
The pair would see more upside to near the psychological level of 150.00 and the March 28 high of 151.20 if it breaks above the July 16 high of 149.19.
On the flip side, a reversal move by the pair below the July 24 low of 145.85 would pave the way for the July 7 low at 144.22, followed by the July 3 low of 143.45.
USD/JPY daily chart
Read more
* The content presented above, whether from a third party or not, is considered as general advice only. This article should not be construed as containing investment advice, investment recommendations, an offer of or solicitation for any transactions in financial instruments.


