USD/JPY Price Analysis: Rises past 161.00 as Powell stays cautious

Mitrade
coverImg
Source: DepositPhotos

■USD/JPY edges higher eyeing YTD high of 161.95 with strong RSI support.

■Formation of 'morning star' pattern suggests potential for further gains above 162.00.

■Key support at July 8 low of 160.26, with significant resistance at November 1986 high of 164.87.


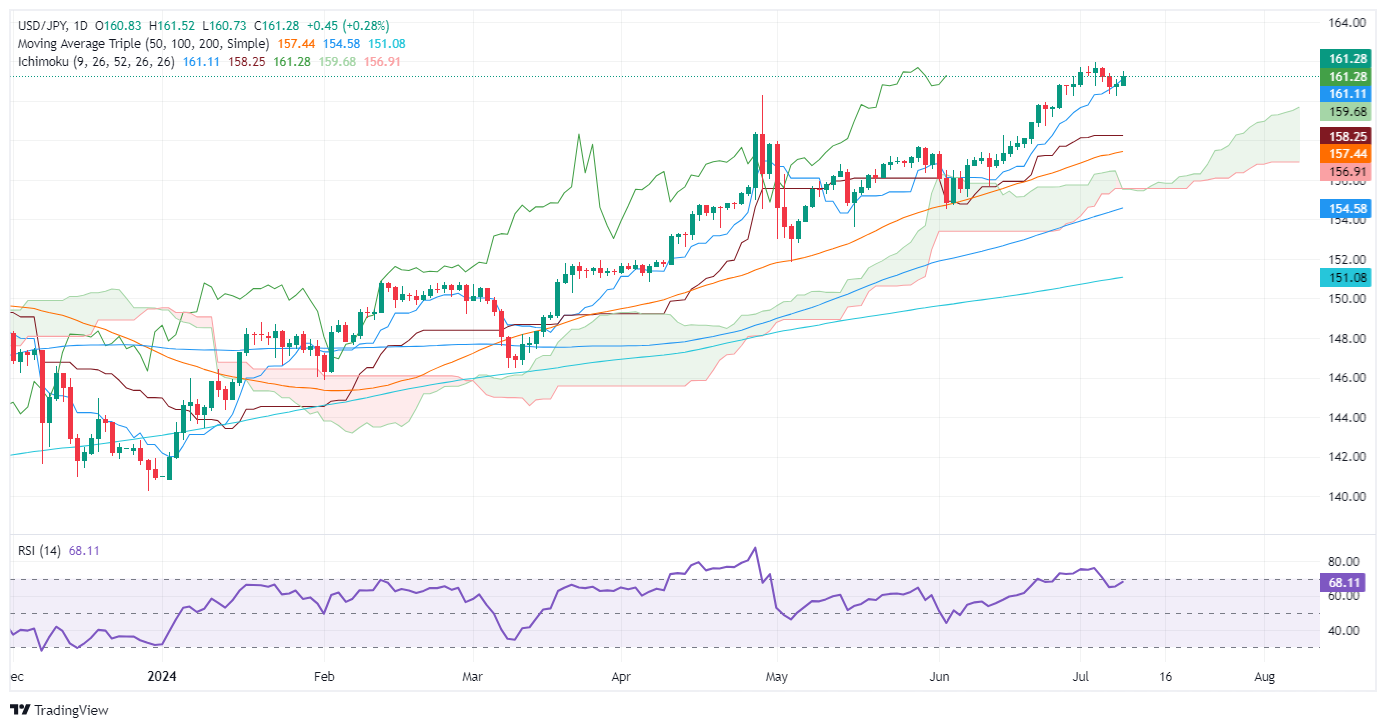
The USD/JPY advanced for the second straight day and climbed above the 161.00 figure on Tuesday as Fed Chair Jerome Powell remained cautious on rate cuts despite acknowledging that the US central bank's dual mandate risks are more balanced. The pair trades at 161.29 and gains 0.28%.


USD/JPY Price Analysis: Technical outlook


The USD/JPY pair's uptrend is robust, with buyers poised to surpass the year-to-date (YTD) high of 161.95. The bullish Relative Strength Index (RSI) indicates the momentum is in their favor. Despite hovering around overbought conditions, the successive series of higher highs and higher lows justifies another leg up.


The major snapped back-to-back days of losses as a doji emerged on Monday, and today’s price action completed a ‘morning star’ chart pattern, hinting that a higher price loom.


If USD/JPY clears the psychological 161.50, the next resistance would be the YTD high ahead of 162.00. Additional gains lie overhead at the November 1986 high of 164.87.


On the other hand, if sellers step in and drag the USD/JPY exchange rate below the July 8 cycle low of 160.26, that will clear the path to challenging the 160.00 figure.


USD/JPY Price Action – Daily Chart

Read more

  • Brent Crude Oil Price Forecast: Trump Eases Sanctions on Russia, Oil Prices Under Pressure Below $110, Can They Still Rise?
  • Bitcoin's double top at $88,000: why $78,000 is the line that decides the next move
  • * The content presented above, whether from a third party or not, is considered as general advice only.  This article should not be construed as containing investment advice, investment recommendations, an offer of or solicitation for any transactions in financial instruments.

    goTop
    quote
    Related Articles
    placeholder
    Brent slips from $110 as Russian supply prospects return — is the five-month rally over?Brent crude traded near $108.06 on Monday (-1.71%), pulling back from last week's $110 high after Washington moved to ease restrictions on Russian oil flows. WTI hovered around $101 before dipping below $99. The retreat is real, but so is the supply-risk premium: Hormuz shipping disruptions, attacks on Saudi energy infrastructure and strikes on Russian refineries remain live. Here are the three numbers, the transmission chain and the levels that matter.
    Author  Irene Q.
    23 hours ago
    Brent crude traded near $108.06 on Monday (-1.71%), pulling back from last week's $110 high after Washington moved to ease restrictions on Russian oil flows. WTI hovered around $101 before dipping below $99. The retreat is real, but so is the supply-risk premium: Hormuz shipping disruptions, attacks on Saudi energy infrastructure and strikes on Russian refineries remain live. Here are the three numbers, the transmission chain and the levels that matter.
    placeholder
    Gold retests $4,200 as dollar and yields retreat — can bullion clear its hardest level?Spot gold traded near $4,175 on Monday (+0.23%), with an intraday high of $4,187.71 after last week's $4,073 ~ $4,217 range; COMEX futures briefly topped $4,200. The dollar slipped to 101.76 and 10-year yields eased from their highs, but October Fed hike odds near 52% and BofA's sub-$4,000 call still cap the upside. Here are the drivers, the levels and what would flip the script.
    Author  Irene Q.
    23 hours ago
    Spot gold traded near $4,175 on Monday (+0.23%), with an intraday high of $4,187.71 after last week's $4,073 ~ $4,217 range; COMEX futures briefly topped $4,200. The dollar slipped to 101.76 and 10-year yields eased from their highs, but October Fed hike odds near 52% and BofA's sub-$4,000 call still cap the upside. Here are the drivers, the levels and what would flip the script.
    placeholder
    Gold defends $4,100 as BofA targets a break below $4,000 — why the Middle East bid is missingSpot gold flushed to $4,099.89, a whisker above October's $4,090 low, then rebounded to close at $4,138.25 (+0.82%) — even as US CPI ran hot. Bank of America sees gold below $4,000 within three months, citing shrinking demand and official-sector selling. Here are the levels, the drivers and what would flip the script.
    Author  Irene Q.
    Oct 15, Thu
    Spot gold flushed to $4,099.89, a whisker above October's $4,090 low, then rebounded to close at $4,138.25 (+0.82%) — even as US CPI ran hot. Bank of America sees gold below $4,000 within three months, citing shrinking demand and official-sector selling. Here are the levels, the drivers and what would flip the script.
    placeholder
    US September CPI recap: inflation hits 3.7% as core runs hot — is an October Fed hike back on the table?September CPI landed hot: headline 3.7% y/y, core 2.6% y/y and 0.3% m/m. October hike odds jumped from ~22% to ~37% — yet the dollar faded to 101.74, gold closed higher and the S&P 500 fell 1.11%. Here is the full repricing, the levels and what to watch next.
    Author  Irene Q.
    Oct 15, Thu
    September CPI landed hot: headline 3.7% y/y, core 2.6% y/y and 0.3% m/m. October hike odds jumped from ~22% to ~37% — yet the dollar faded to 101.74, gold closed higher and the S&P 500 fell 1.11%. Here is the full repricing, the levels and what to watch next.
    placeholder
    US September CPI Preview: Inflation May Heat Up, How Will US Stocks, Dollar and Gold React?The U.S. will release its September CPI data on Wednesday (October 14) Eastern Time, which will be one of the most important inflation reports ahead of the Federal Reserve's October 27-28
    Author  TradingKey
    Oct 13, Tue
    The U.S. will release its September CPI data on Wednesday (October 14) Eastern Time, which will be one of the most important inflation reports ahead of the Federal Reserve's October 27-28
    Live Quotes
    Name / SymbolChart% Change / Price
    USDJPY
    USDJPY
    0.00%0.00

    USD Related Articles

    • Financial Markets 2026: Volatility Catalysts in Gold, Silver, Oil, and Blue-Chip Stocks—A CFD Trader's Outlook
    • Best Currency Pairs To Trade 2026: Guide to Choosing Currency Pairs
    • Trading Chart Patterns:Ultimate Guide to Price Action
    • Australian Dollar Forecast In 2024/2025/2026: Should I Buy AUD/USD Or Other AUD Currency Pairs?
    • AUD/USD holds above 0.6500, eyes on RBA Minutes

    Click to view more