EUR/USD grinds chart paper above 1.0800 after Fed fails to spark rate rally

Mitrade
coverImg
Source: DepositPhotos

■EUR/USD continues to chill after testing above 1.0840 this week.

■Fedspeak from Fed Chair Powell failed to deliver a dovish-enough stance.

■US inflation data to be the key print later in the week.


EUR/USD continues to settle closer to 1.0800 after a misfire in market expectations of Federal Reserve (Fed) Chairman Jerome Powell’s testimony before US Congress on Tuesday. Despite a head nod to improving inflation figures, the Fed is still leaning firmly in a cautionary stance, pulling the rug from beneath markets that were coiled in anticipation of a tonal shift from Fed policymakers.


Forex Today: Focus remains on Powell and Fedspeak


Traders are battening down the hatches for the wait to key US inflation data prints later in the week, with a smattering of Fed speakers and Fed Chair Powell’s second round of testifying due on Wednesday.


US Consumer Price Index (CPI) inflation data slated for Thursday will be the key driver of market volumes in the back half of the trading week. Investors hungry for rate cuts will be looking for CPI inflation to churn lower, but median market forecasting models broadly expect annualized core CPI for the year ended in June to hold steady at 3.4% YoY, while headline CPI inflation is expected to tick upwards to 0.1% MoM in June versus the previous flat print of 0.0%.


Initial Jobless Claims for the week ended July 5 are also on the docket for Thursday, and are forecast to tick down to 236K from the previous 238K.


Finally, German Harmonized Index of Consumer Prices (HICP) inflation figures are due early Thursday, but YoY German inflation in June is expected to hold steady at the previous print of 2.5%.


EUR/USD technical outlook


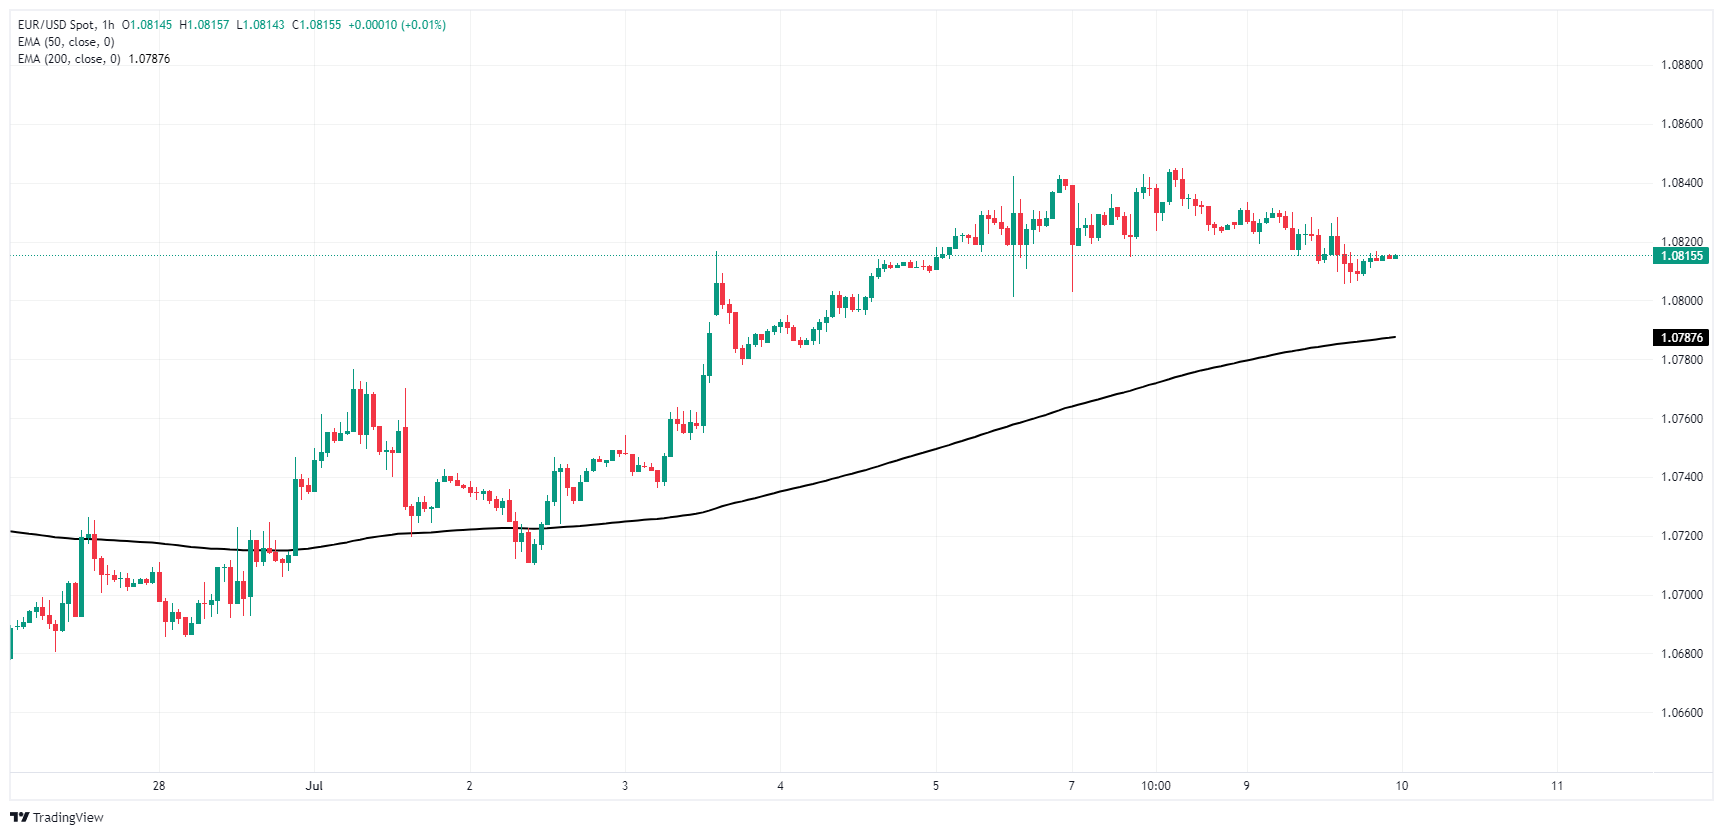
The Fiber is on a slow grind near 1.0800 after peaking earlier this week just north of 1.0840, and intraday price action is getting squeezed between downside pressure and technical support from the 200-hour Exponential Moving Average (EMA) at 1.0787.


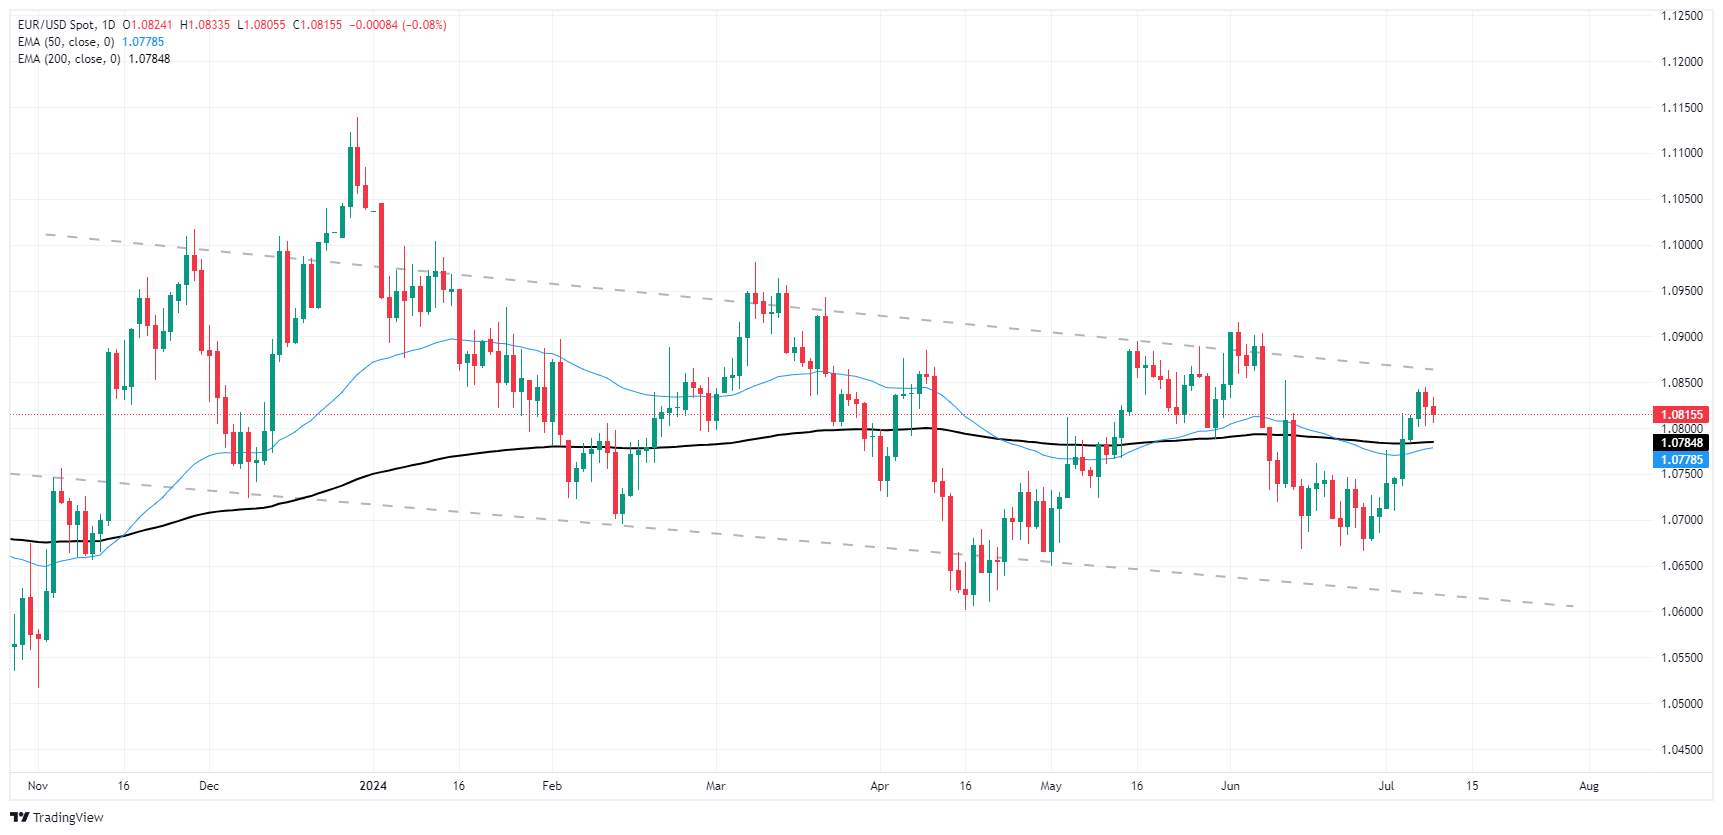
EUR/USD looks set to run out of gas in a near-term bullish push from the last swing low near 1.0660. With momentum draining out of the Fiber, the pair is set for a tumble back below the 200-day EMA at 1.0784.


EUR/USD hourly chart

EUR/USD daily chart

Read more

  • Gold Faces Pressure Ahead of Fed Decision as Prices Extend Drop Below $4,000
  • Gold Price Analysis Today | Forex Gold Analysis | XAU/USD Analysis - October 23, 2026
  • * The content presented above, whether from a third party or not, is considered as general advice only.  This article should not be construed as containing investment advice, investment recommendations, an offer of or solicitation for any transactions in financial instruments.

    goTop
    quote
    Related Articles
    placeholder
    Dollar presses 102 as the 10-year yield sits at 5.14% — and October hike odds are only 17%The dollar index closed at 101.99 (+0.20%) on Monday after briefly topping 102.07, while the 10-year Treasury yield rose to 5.14% and the 2-year hit 4.774% — yet futures price only about a 17% chance of a hike at the October 27-28 FOMC, versus roughly 90% for December. The driver is a global bond selloff, not a Fed repricing: France's 10-year OAT jumped to 4.84% ~ 4.94% and the OAT-Bund spread widened to 140 ~ 146bp. Here are the levels, the cross-asset read-through and what to watch.
    Author  Irene Q.
    Oct 20, Tue
    The dollar index closed at 101.99 (+0.20%) on Monday after briefly topping 102.07, while the 10-year Treasury yield rose to 5.14% and the 2-year hit 4.774% — yet futures price only about a 17% chance of a hike at the October 27-28 FOMC, versus roughly 90% for December. The driver is a global bond selloff, not a Fed repricing: France's 10-year OAT jumped to 4.84% ~ 4.94% and the OAT-Bund spread widened to 140 ~ 146bp. Here are the levels, the cross-asset read-through and what to watch.
    placeholder
    Brent slips from $110 as Russian supply prospects return — is the five-month rally over?Brent crude traded near $108.06 on Monday (-1.71%), pulling back from last week's $110 high after Washington moved to ease restrictions on Russian oil flows. WTI hovered around $101 before dipping below $99. The retreat is real, but so is the supply-risk premium: Hormuz shipping disruptions, attacks on Saudi energy infrastructure and strikes on Russian refineries remain live. Here are the three numbers, the transmission chain and the levels that matter.
    Author  Irene Q.
    Oct 19, Mon
    Brent crude traded near $108.06 on Monday (-1.71%), pulling back from last week's $110 high after Washington moved to ease restrictions on Russian oil flows. WTI hovered around $101 before dipping below $99. The retreat is real, but so is the supply-risk premium: Hormuz shipping disruptions, attacks on Saudi energy infrastructure and strikes on Russian refineries remain live. Here are the three numbers, the transmission chain and the levels that matter.
    placeholder
    Gold retests $4,200 as dollar and yields retreat — can bullion clear its hardest level?Spot gold traded near $4,175 on Monday (+0.23%), with an intraday high of $4,187.71 after last week's $4,073 ~ $4,217 range; COMEX futures briefly topped $4,200. The dollar slipped to 101.76 and 10-year yields eased from their highs, but October Fed hike odds near 52% and BofA's sub-$4,000 call still cap the upside. Here are the drivers, the levels and what would flip the script.
    Author  Irene Q.
    Oct 19, Mon
    Spot gold traded near $4,175 on Monday (+0.23%), with an intraday high of $4,187.71 after last week's $4,073 ~ $4,217 range; COMEX futures briefly topped $4,200. The dollar slipped to 101.76 and 10-year yields eased from their highs, but October Fed hike odds near 52% and BofA's sub-$4,000 call still cap the upside. Here are the drivers, the levels and what would flip the script.
    placeholder
    Gold defends $4,100 as BofA targets a break below $4,000 — why the Middle East bid is missingSpot gold flushed to $4,099.89, a whisker above October's $4,090 low, then rebounded to close at $4,138.25 (+0.82%) — even as US CPI ran hot. Bank of America sees gold below $4,000 within three months, citing shrinking demand and official-sector selling. Here are the levels, the drivers and what would flip the script.
    Author  Irene Q.
    Oct 15, Thu
    Spot gold flushed to $4,099.89, a whisker above October's $4,090 low, then rebounded to close at $4,138.25 (+0.82%) — even as US CPI ran hot. Bank of America sees gold below $4,000 within three months, citing shrinking demand and official-sector selling. Here are the levels, the drivers and what would flip the script.
    placeholder
    US September CPI recap: inflation hits 3.7% as core runs hot — is an October Fed hike back on the table?September CPI landed hot: headline 3.7% y/y, core 2.6% y/y and 0.3% m/m. October hike odds jumped from ~22% to ~37% — yet the dollar faded to 101.74, gold closed higher and the S&P 500 fell 1.11%. Here is the full repricing, the levels and what to watch next.
    Author  Irene Q.
    Oct 15, Thu
    September CPI landed hot: headline 3.7% y/y, core 2.6% y/y and 0.3% m/m. October hike odds jumped from ~22% to ~37% — yet the dollar faded to 101.74, gold closed higher and the S&P 500 fell 1.11%. Here is the full repricing, the levels and what to watch next.
    Live Quotes
    Name / SymbolChart% Change / Price
    EURUSD
    EURUSD
    0.00%0.00

    USD Related Articles

    • Financial Markets 2026: Volatility Catalysts in Gold, Silver, Oil, and Blue-Chip Stocks—A CFD Trader's Outlook
    • Best Currency Pairs To Trade 2026: Guide to Choosing Currency Pairs
    • Trading Chart Patterns:Ultimate Guide to Price Action
    • Australian Dollar Forecast In 2024/2025/2026: Should I Buy AUD/USD Or Other AUD Currency Pairs?
    • AUD/USD holds above 0.6500, eyes on RBA Minutes

    Click to view more