

WTI Crude slips as traders await US inventory data and digest OPEC+ supply increase
- WTI Crude trades near $65.50 as traders await key US Oil inventory data at 20:30 GMT.
- OPEC+ report signals rising supply through Q3, reinforcing pressure on WTI.
- Technical pressure builds as WTI slips below key moving average support at $64.81.
West Texas Intermediate (WTI) Crude Oil remains under pressure on Tuesday as a growing global supply outlook weighs on sentiment.
At the time of writing, WTI is trading above $65.00 with daily losses of 0.55%. Traders are digesting the latest supply guidance from the Organization of the Petroleum Exporting Countries (OPEC) and awaiting key US inventory data later in the day.
The ongoing production expansion by OPEC+ and sluggish US refinery demand are reinforcing downside pressure.
OPEC+ report signals rising supply through Q3, reinforcing pressure on WTI
OPEC’s July Monthly Oil Market Report reaffirmed expectations for increased oil supply through the third quarter. The report highlighted firm demand in Asia and improving macroeconomic conditions in the United States and the Eurozone.
The Declaration of Cooperation (DoC) group, also known as OPEC+, comprises OPEC members, including Saudi Arabia, Iraq, Iran, and the UAE, as well as non-OPEC allies such as Russia, Kazakhstan, and Mexico.
The report stated that “The DoC group has agreed to gradually increase production levels starting [in] July, with a phased approach continuing into August,” OPEC stated.
“This is based on continued robust demand in Asia and a rebound in major Western economies.”
In June, OPEC+ Crude Oil production rose by 349,000 barrels per day (bpd), bringing the total group production to 41.56 million bpd.
OPEC also projected that non-OPEC liquids production will rise by 0.8 million barrels per day in 2025, led by the United States, Brazil and Canada.
US API inventory in focus as WTI falls
The American Petroleum Institute (API) is set to release its Weekly Crude Oil Stock report at 20:30 GMT. The release is closely watched for near-term price implications.
Following last week’s surprise 7.1 million barrel build, market expectations are for a 2 million barrel draw.
A larger-than-expected draw could offer temporary support for WTI, while another build may intensify bearish momentum.
Oil technical analysis: WTI Crude heads toward moving average support at $64.81
On the daily chart, WTI is trading above $65.00 as the price approaches a critical support level at the 100-day Simple Moving Average (SMA) at $64.81. The 50-day SMA is currently positioned just below $64.71, forming a key confluence zone.
A sustained break below the 38.2% Fibonacci retracement of the January-April decline at $64.18 would expose the June 24 low at $63.73, potentially opening the door to further downside toward $60.58.
WTI Crude Oil daily chart
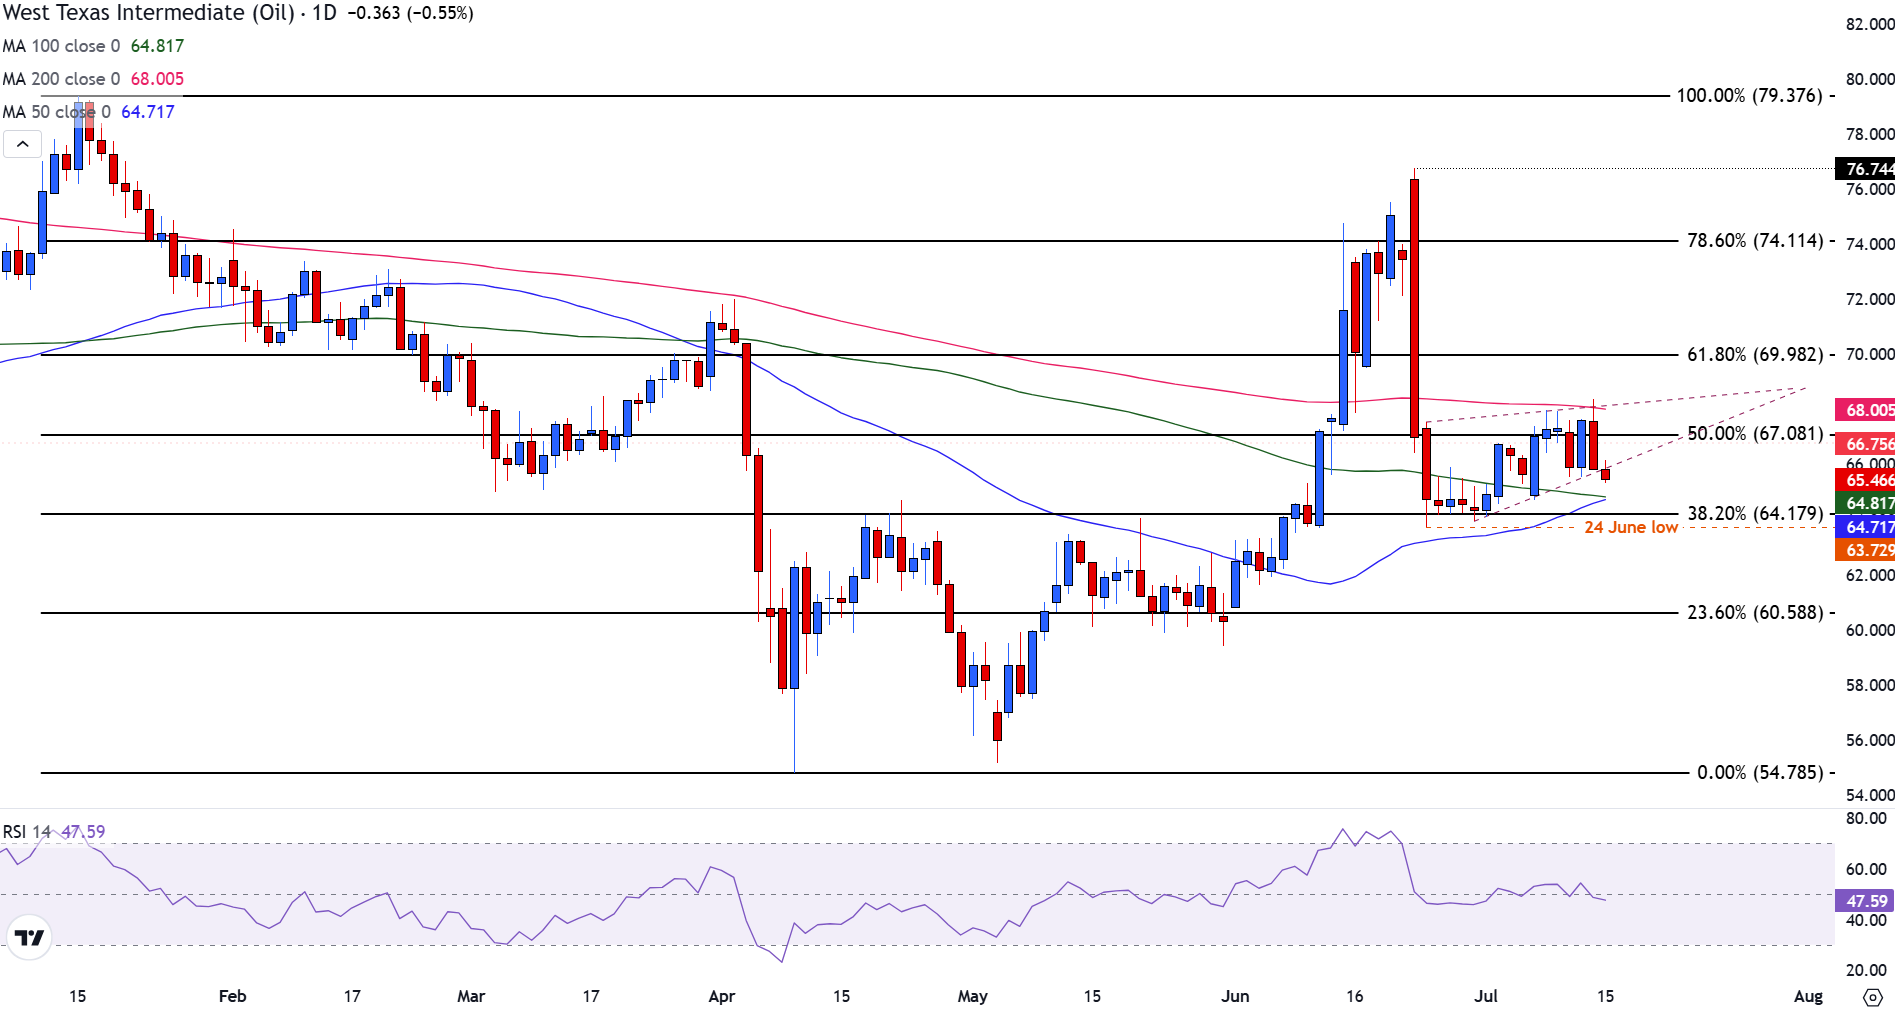
Momentum indicators also show deterioration, with the Relative Strength Index (RSI) drifting lower to 47, reflecting fading bullish momentum while remaining above oversold conditions.
On the upside, resistance remains firm at $66.75, a level that aligns closely with the recent highs from July 10-12, where WTI peaked and reversed.
This area also sits just below the 50% retracement, reinforcing its importance as a psychological resistance zone near $67.08. Further resistance lies at the 200-day SMA at $68.00, capping any near-term recovery attempts.
WTI Oil FAQs
WTI Oil is a type of Crude Oil sold on international markets. The WTI stands for West Texas Intermediate, one of three major types including Brent and Dubai Crude. WTI is also referred to as “light” and “sweet” because of its relatively low gravity and sulfur content respectively. It is considered a high quality Oil that is easily refined. It is sourced in the United States and distributed via the Cushing hub, which is considered “The Pipeline Crossroads of the World”. It is a benchmark for the Oil market and WTI price is frequently quoted in the media.
Like all assets, supply and demand are the key drivers of WTI Oil price. As such, global growth can be a driver of increased demand and vice versa for weak global growth. Political instability, wars, and sanctions can disrupt supply and impact prices. The decisions of OPEC, a group of major Oil-producing countries, is another key driver of price. The value of the US Dollar influences the price of WTI Crude Oil, since Oil is predominantly traded in US Dollars, thus a weaker US Dollar can make Oil more affordable and vice versa.
The weekly Oil inventory reports published by the American Petroleum Institute (API) and the Energy Information Agency (EIA) impact the price of WTI Oil. Changes in inventories reflect fluctuating supply and demand. If the data shows a drop in inventories it can indicate increased demand, pushing up Oil price. Higher inventories can reflect increased supply, pushing down prices. API’s report is published every Tuesday and EIA’s the day after. Their results are usually similar, falling within 1% of each other 75% of the time. The EIA data is considered more reliable, since it is a government agency.
OPEC (Organization of the Petroleum Exporting Countries) is a group of 12 Oil-producing nations who collectively decide production quotas for member countries at twice-yearly meetings. Their decisions often impact WTI Oil prices. When OPEC decides to lower quotas, it can tighten supply, pushing up Oil prices. When OPEC increases production, it has the opposite effect. OPEC+ refers to an expanded group that includes ten extra non-OPEC members, the most notable of which is Russia.
Recommended Articles


