
GBP/USD Price Analysis: Struggles near multi-week low, around 1.3430 ahead of US CPI


GBP/USD enters a bearish consolidation phase near a multi-week low touched earlier this Tuesday.
The fundamental and technical setup backs the case for a further near-term depreciating move.
Traders, however, seem reluctant and opt to wait for the latest US consumer inflation figures.
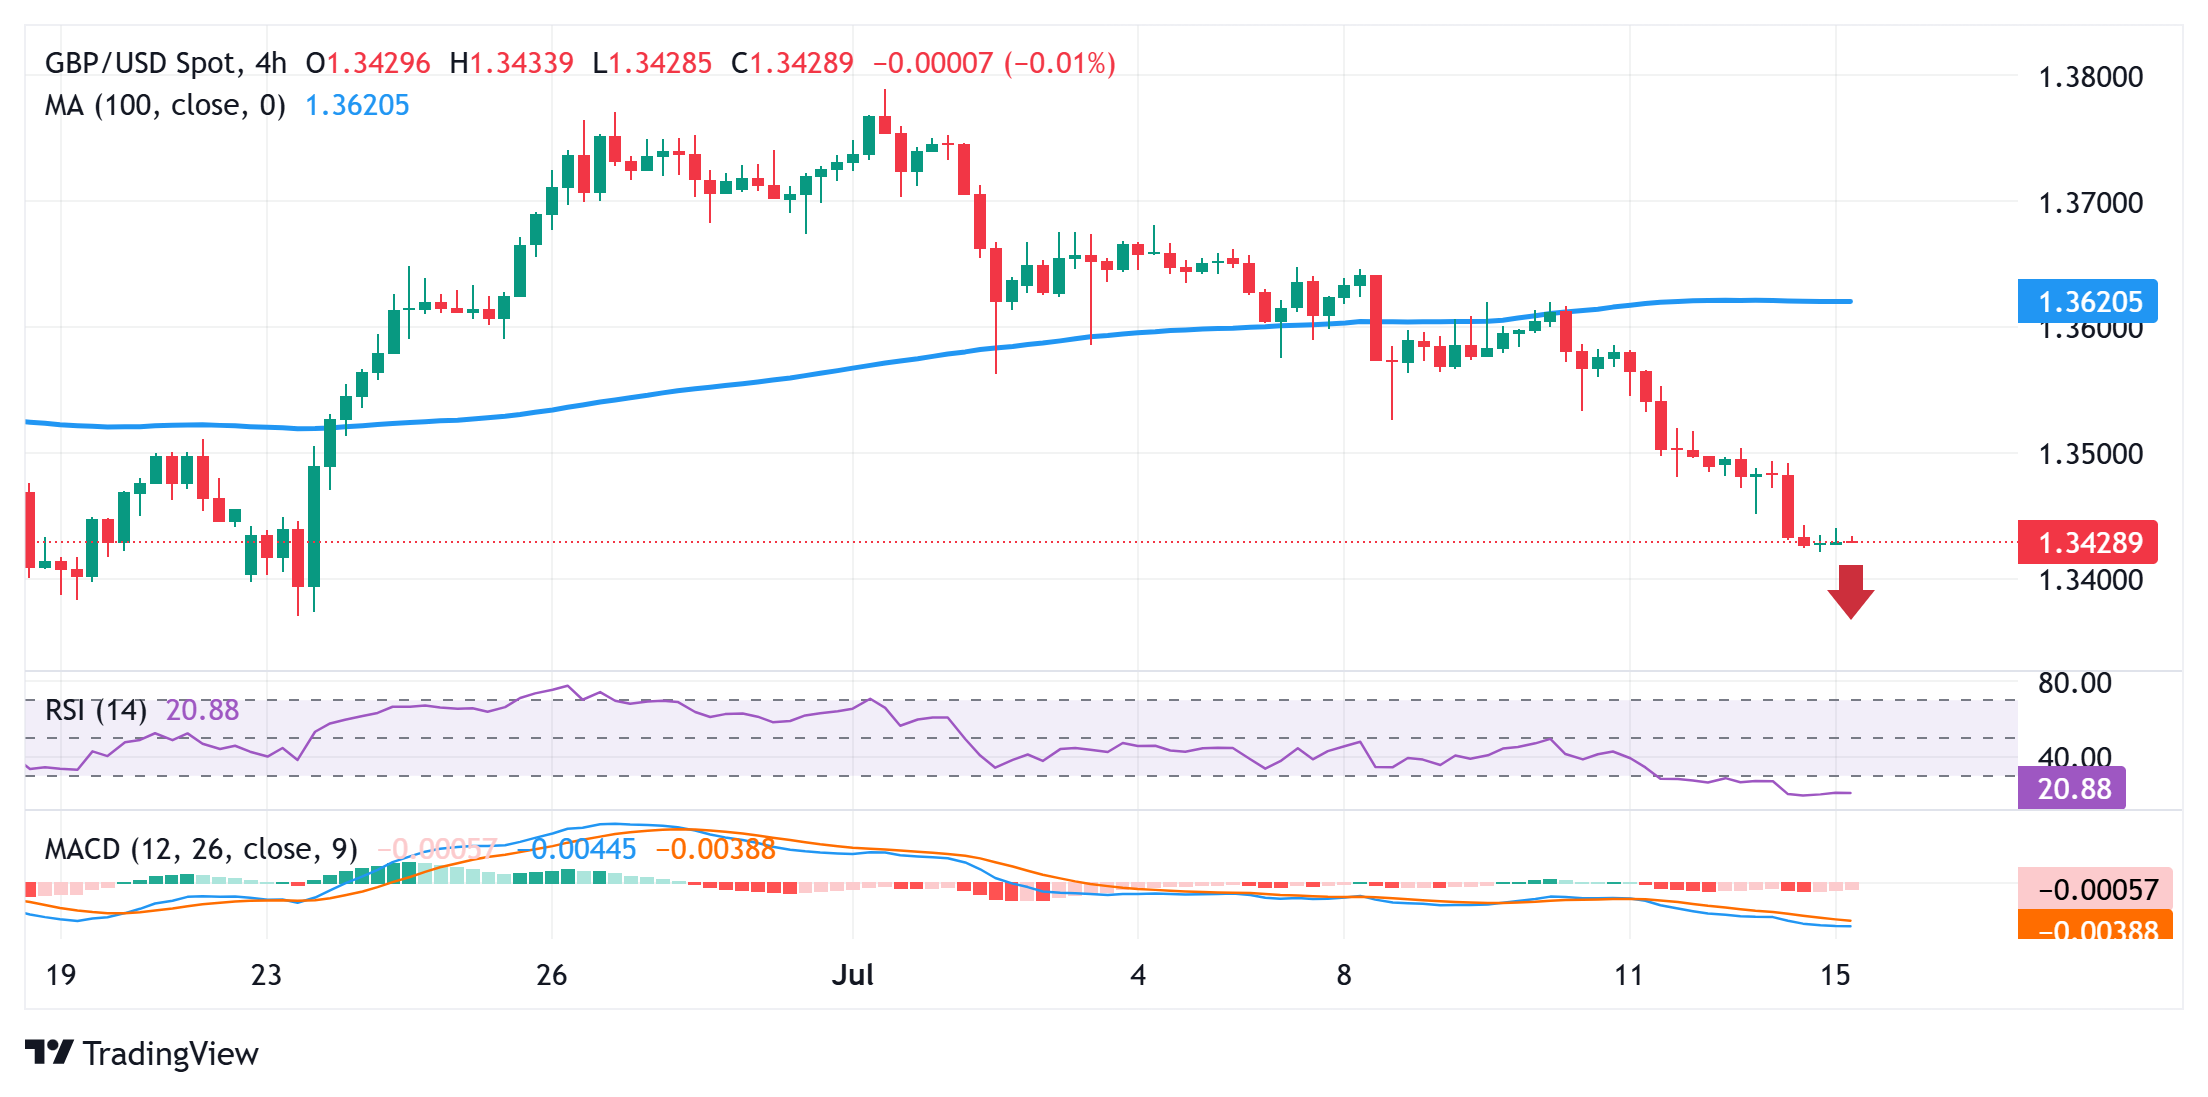
The GBP/USD pair consolidates near the 1.3430-1.3435 region, just above a three-week low touched during the Asian session on Tuesday as traders keenly await the release of the US consumer inflation figure. Meanwhile, the fundamental backdrop seems tilted in favor of bears and suggests that the path of least resistance for spot prices is to the downside.
The disappointing macro data released from the UK last week reinforced bets that the Bank of England (BoE) could cut interest rates again in August. This marks a significant divergence in comparison to diminishing odds for an immediate rate cut by the Federal Reserve (Fed) and validates the negative outlook for the GBP/USD pair. That said, a modest US Dollar (USD) pullback from a multi-week high lends support to the currency pair.
From a technical perspective, last week's breakdown below the 100-period Simple Moving Average (SMA) on the 4-hour chart was seen as a key trigger for bearish traders. However, the Relative Strength Index (RSI) on the said chart is already flashing oversold conditions. This makes it prudent to wait for some intraday consolidation or a modest bounce before positioning for any further near-term depreciating move for the GBP/USD pair.
That said, any attempted recovery is likely to be sold into around the 1.3470 region. This, in turn, should cap spot prices near the 1.3500 psychological mark, which should now act as a key pivotal point. Hence, a sustained strength beyond the said handle could trigger a short-covering move and lift the GBP/USD pair towards the 1.3550 intermediate hurdle en route to the 1.3600 round figure and the 1.3620-1.3625 supply zone.
On the flip side, bears might wait for a convincing break below the 1.3400 mark before placing fresh bets. The GBP/USD pair might then accelerate the fall towards the next relevant support near the 1.3355 region before eventually dropping to the 1.3300 round figure. The downward trajectory could extend further towards the 100-day Simple Moving Average (SMA) support, currently pegged near the 1.3265 region.
GBP/USD 4-hour chart
* The content presented above, whether from a third party or not, is considered as general advice only. This article should not be construed as containing investment advice, investment recommendations, an offer of or solicitation for any transactions in financial instruments.


