
Bitcoin Retreats After Hitting Record High — Drops Below $120K

- Gold tumbles as traders book profits ahead of key US inflation data
- Gold declines as traders brace for trade talks, US CPI inflation data
- US CPI headline inflation set to rise 3.1% YoY in September
- Australian Dollar maintains position due to US-China trade optimism
- Fed’s October Rate Cut: Easing Cycle Continues, Gold Likely to Keep Rising
- Forex Today: Mood improves on US-China trade deal optimism

TradingKey – On Tuesday, July 15, Bitcoin (BTC) reversed sharply after reaching a new all-time high of $123,218 the previous night. At press time, BTC is trading at $118,871, slipping below the $120,000 threshold, with its market cap briefly touching $2.44 trillion.
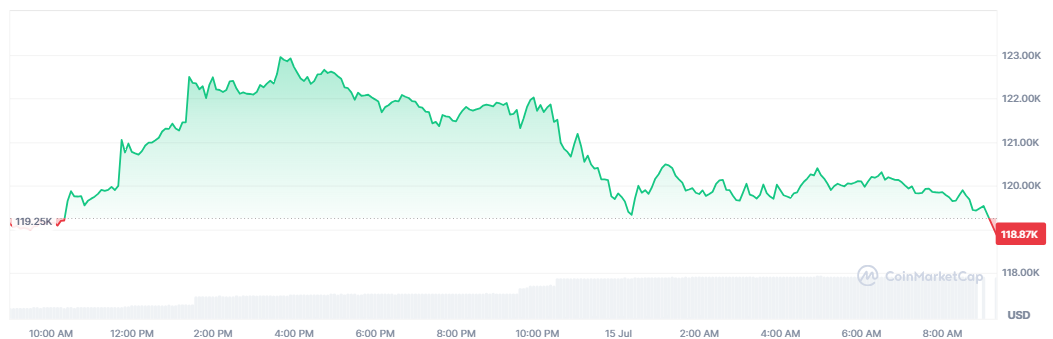
Bitcoin Price Chart – Source: CoinMarketCap.
According to CryptoQuant analyst Tarek J, the pullback is not driven by negative news but rather by profit-taking behavior. He noted that such reversals often signal a local top, potentially leading to short-term consolidation or correction.
However, Greeks.live macro strategist Adam offered a different view. He emphasized that bullish sentiment remains strong, with many traders eyeing $130,000 as the next resistance level.
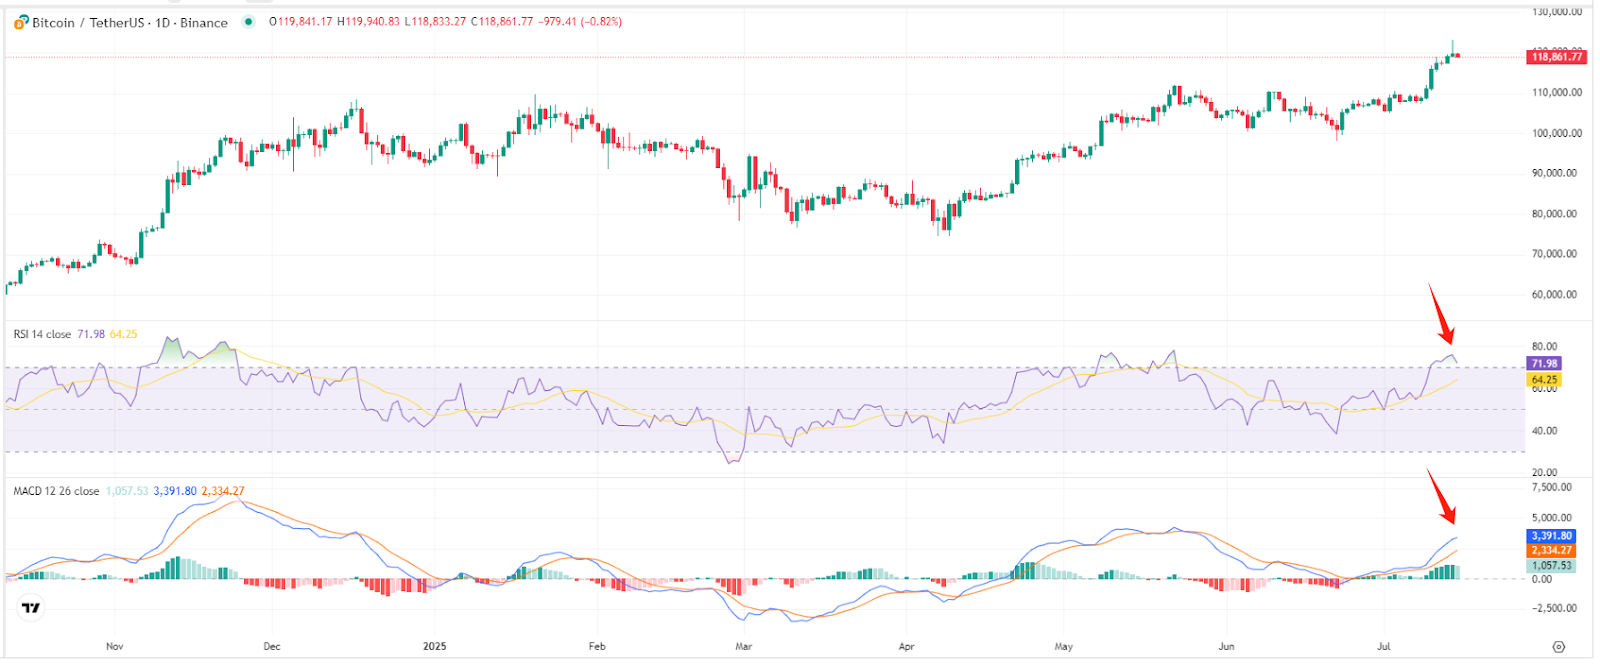
Still, technical indicators like RSI and MACD suggest overbought conditions, and bearish signals are emerging. A correction toward $110,000 could be on the horizon.
Bitcoin Price Chart – Source: TradingView.
Read more
* The content presented above, whether from a third party or not, is considered as general advice only. This article should not be construed as containing investment advice, investment recommendations, an offer of or solicitation for any transactions in financial instruments.


