

SOL Price Topside Bias Vulnerable If Solana Continues To Struggle Below $170

- Gold Price Forecast: Gold Poised to Break $4,200 as Oil Price Slump Eases Inflation Fears
- Gold declines despite easing concerns over inflation, interest rate hikes
- Gold Price Forecast: Oil Price Breaking $100 Fuels Inflation Concerns, Will Gold Prices Fall Further?
- Fed Decision Eve: 104 Economists Expect No Change; Why Is Citadel Securities Betting on a Surprise Hike?
- Gold Price Forecast: Can Gold Hold $4,020 as Fed Rate Hike Expectations Rise?
- Middle East War updates: US-Iran pause strikes as Trump weighs up diplomatic options
Solana attempted a recovery wave above the $140 level. SOL price is now struggling to clear the $160 and $170 resistance levels.
■ SOL price recovered higher and tested the $160 resistance against the US Dollar.
■ The price is now trading below $160 and the 100 simple moving average (4 hours).
■ There is a key bullish trend line forming with support at $146 on the 4-hour chart of the SOL/USD pair (data source from Kraken).
■ The pair could start another decline if it stays below $160 and $170 for a long time.
Solana Price Faces Resistance
Solana price started a major decline below the $170 and $160 support levels. SOL tested the $115 zone and recently started an upside correction, like Bitcoin and Ethereum.
There was a decent increase above the $130 and $140 levels. The price climbed above the 23.6% Fib retracement level of the downward wave from the $205 swing high to the $115 low. It even spiked above the $155 zone and the 100 simple moving average (4 hours).
However, the bears are active near the $160 zone and the 50% Fib retracement level of the downward wave from the $205 swing high to the $115 low. The price struggled and corrected gains.
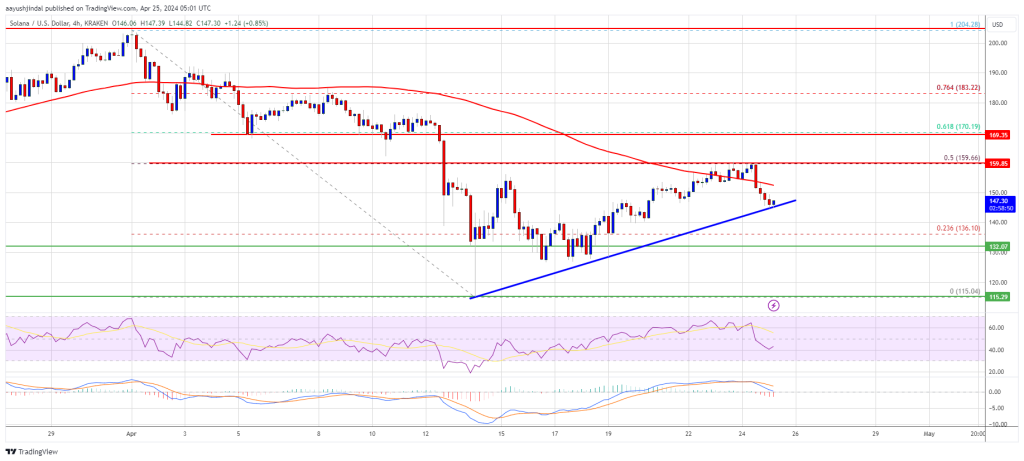
Source: SOLUSD on TradingView.com
Solana is now trading below $160 and the 100 simple moving average (4 hours). There is also a key bullish trend line forming with support at $146 on the 4-hour chart of the SOL/USD pair. Immediate resistance is near the $155 level. The next major resistance is near the $160 level. A successful close above the $160 resistance could set the pace for another major increase. The next key resistance is near $170. Any more gains might send the price toward the $188 level.
Another Decline in SOL?
If SOL fails to rally above the $160 resistance, it could start another decline. Initial support on the downside is near the $145 level and the trend line.
The first major support is near the $132 level, below which the price could test $120. If there is a close below the $120 support, the price could decline toward the $100 support in the near term.
Technical Indicators
4-Hours MACD – The MACD for SOL/USD is gaining pace in the bearish zone.
4-Hours RSI (Relative Strength Index) – The RSI for SOL/USD is below the 50 level.
Major Support Levels – $146, and $132.
Major Resistance Levels – $155, $160, and $170.
Read more
* The content presented above, whether from a third party or not, is considered as general advice only. This article should not be construed as containing investment advice, investment recommendations, an offer of or solicitation for any transactions in financial instruments.


