

Solana Price Forecast: SOL tests $140 support zone amid rising selling pressure

- Gold drops below $4,700 on stronger US Dollar, Middle East tensions
- Bitcoin Returns to $79,000 Level. Prediction Markets Bullish on Breaking $80,000 in April
- Gold holds steady near $4,600 as Fed rate decision looms
- Fed FOMC Meeting Is Approaching: Where Is the Focus? Will There Be More Rate Cuts This Year?
- Goldman Sachs: Structurally Bullish on Gold to $5,400, But Warns of Short-Term Pullback
- WTI sticks to modest gains above $94.00 as Hormuz standoff fuels supply concerns

Solana prolongs the triangle pattern breakdown rally, nearing the $140 support zone.
The derivative data signals a loss of bullish interest as traders anticipate further decline.
The technical outlook suggests an extended correction as bearish momentum increases.
Solana (SOL) edges higher by 2% at press time on Friday as it avoids a drop to the $140 support zone. However, the Solana price trend is approaching its second consecutive bearish week close, following a near 6% drop on Thursday. With the bearish trend, derivatives market sentiment aligns with the technical outlook, anticipating a steeper correction ahead.
Bullish activity declines in Solana derivatives
According to Coinglass, the Solana Open Interest (OI) has dipped by 4.61% in the last 24 hours to $6.46 billion. A perpetual contract’s OI relates to the number of open positions in either futures or options, and its decline translates to a decrease in traders' interest in participating in such agreements.
The declining interest of traders in Solana contracts aligns with the increased volatility, leading to the wipeout of bullish positions. Over the last 24 hours, the long liquidation has reached $46.96 million, while the short liquidations have stalled at $3.50 million.
Furthermore, increased long liquidations result in decreased bullish activity, leading to higher short positions in the market. The ratio of long vs short positions is at 0.9429, signaling a greater number of bearish positions dominating the derivatives field.
Additionally, the OI-weighted funding rate has flipped negative to -0.0083%, signaling payments made from bears to bulls to keep the perpetual swap and spot prices aligned.
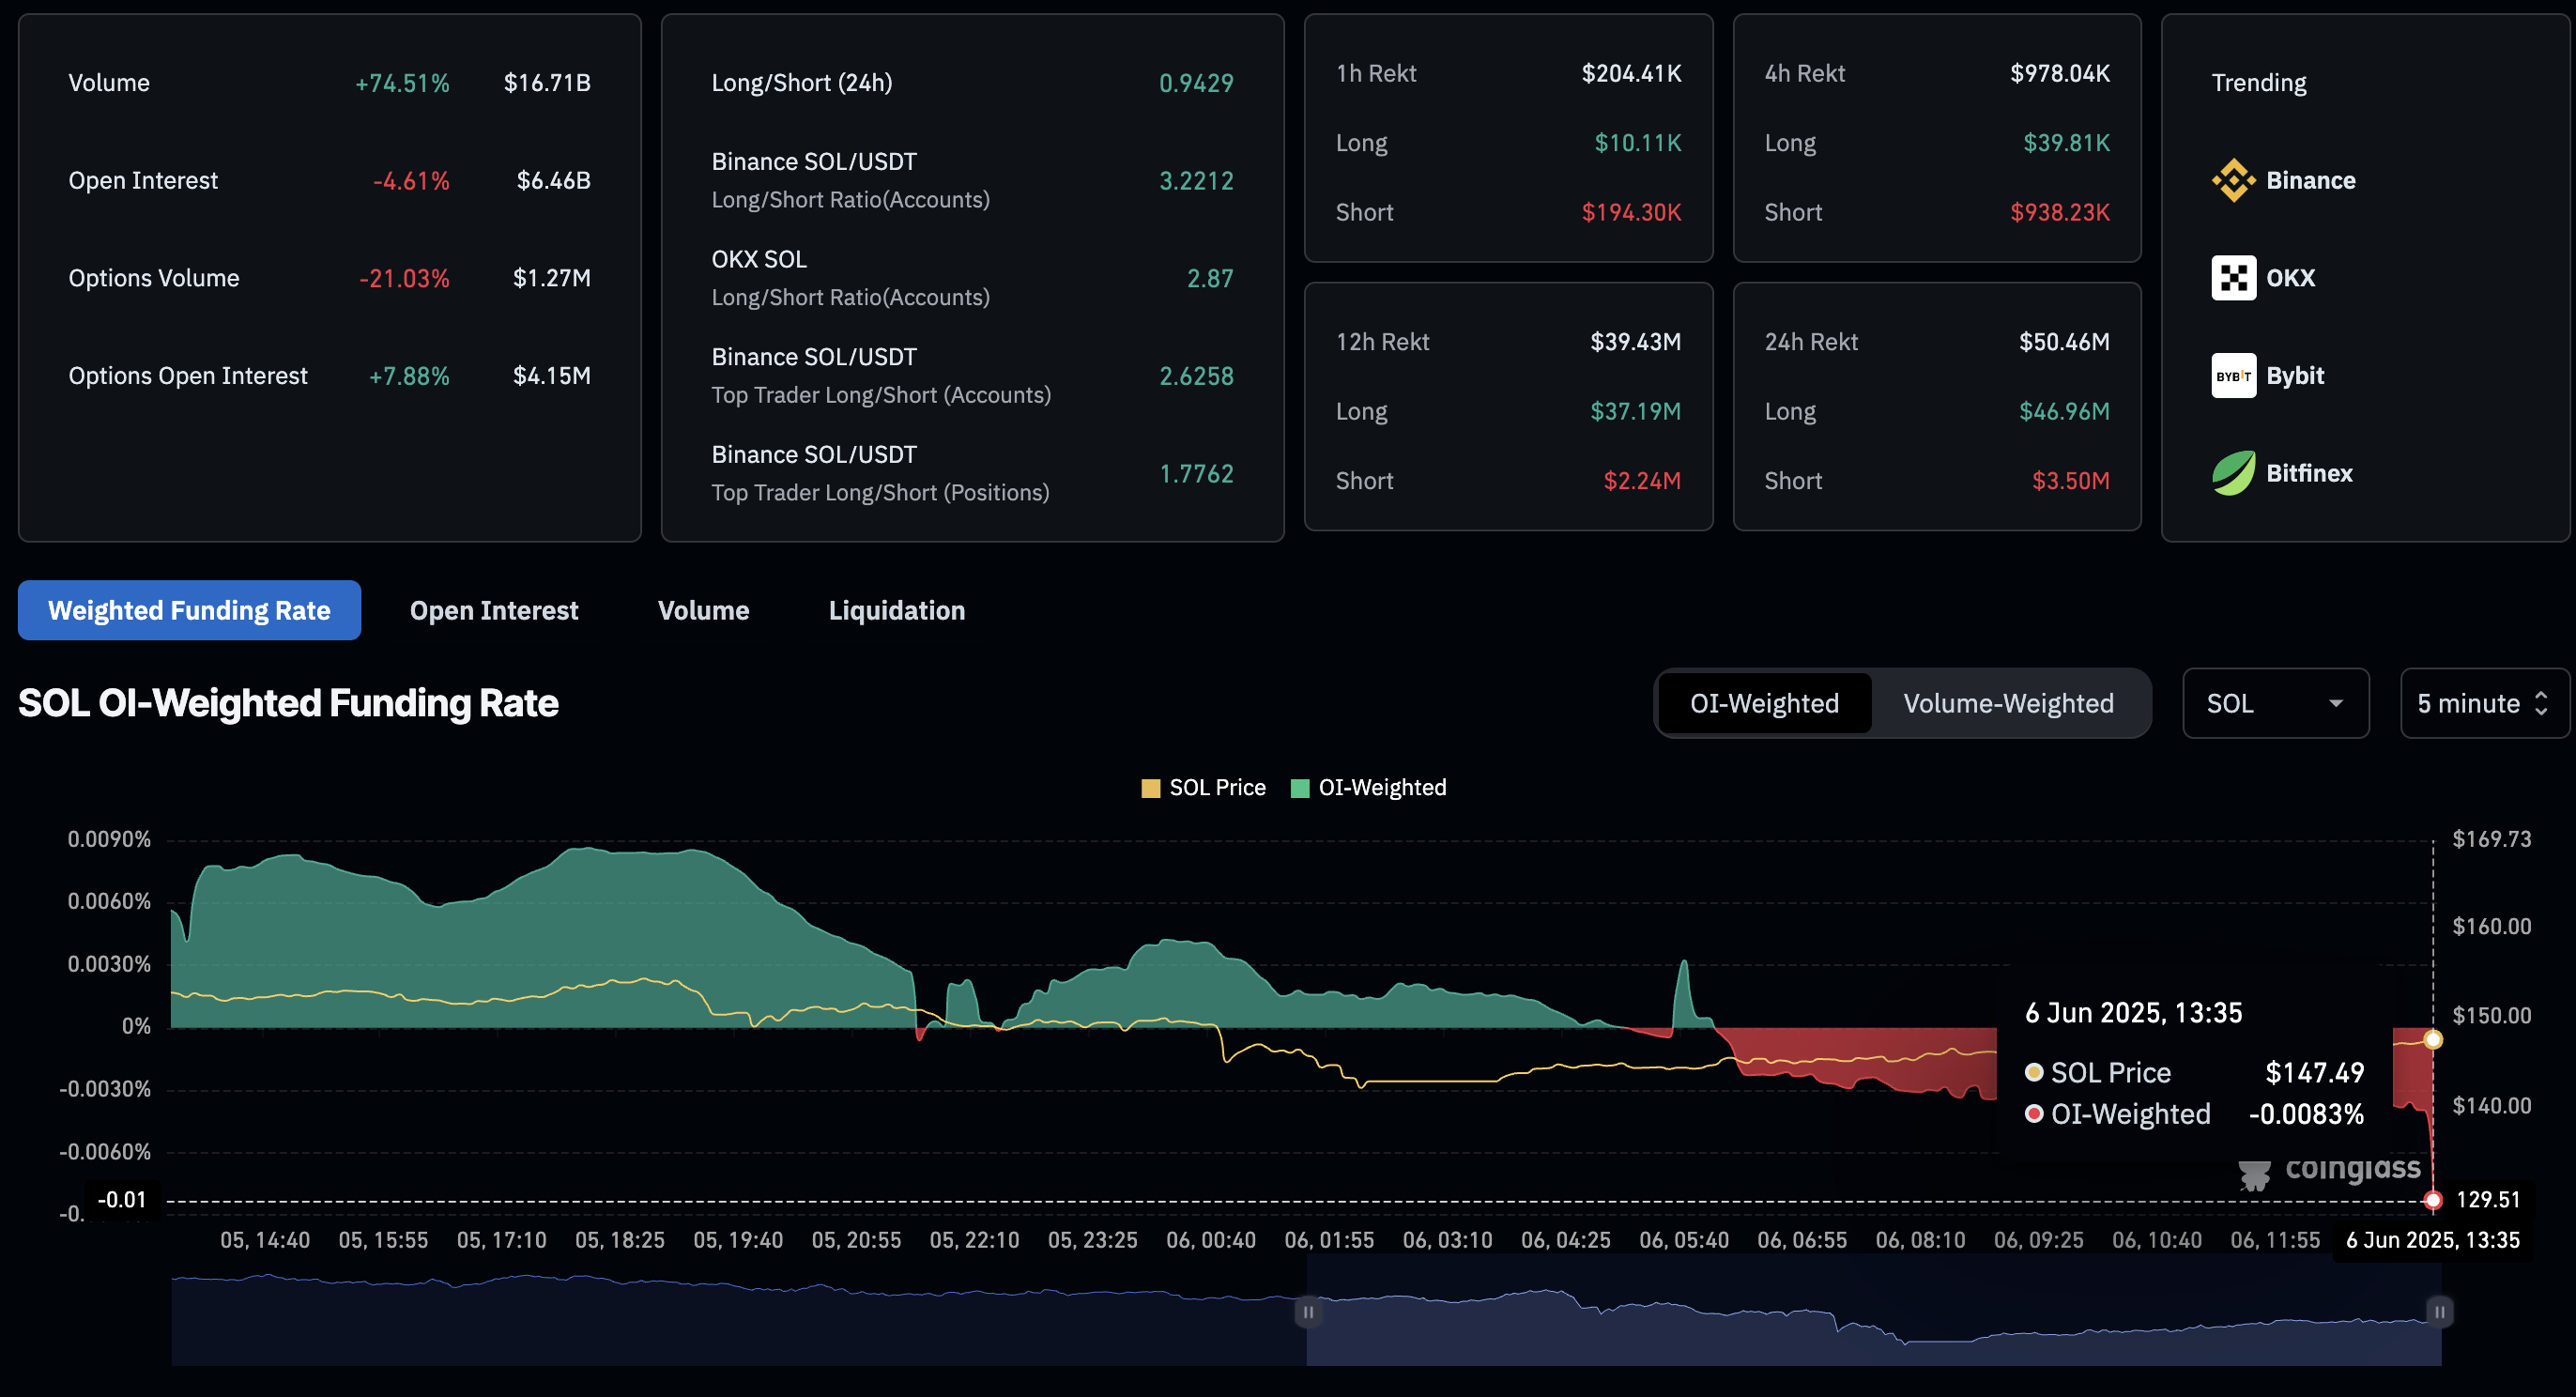
Solana Derivatives Data. Source: Coinglass
Solana nears crucial support as selling pressure grows
Solana has dropped over 20% from its 30-day high of $187.71 set on May 23, as it failed to close above the high supply zone near $180. In addition, the multi-month resistance trendline prolongs the declining trend, with peaks on January 18, May 14, May 23, and May 27.
Notably, the bearish reversal on May 28, resulting in a 2.55% drop, closed below a short-term support trendline that converged with the overhead trendline, completing a triangle pattern. This marked a fallout from a triangle pattern that prolongs Solana’s downfall.
The recent over 5% crash on Thursday flips the trend direction to bearish as Solana closes below the Supertrend Indicator baseline. The flip triggers a sell signal and initiates a bearish trendline at $171, close to the previously mentioned resistance trendline.
Nearing the $140 support zone, the Relative Strength Index (RSI) at 37 shows an increased possibility of another breakdown in Solana. Compared to the previous dip towards the $140 zone on May 4, the RSI has declined significantly in value, suggesting a substantial increase in bearish momentum.
In addition, the Moving Average Convergence/Divergence (MACD) indicator dips below the centre line with a surge in red histogram bars in the negative territory, signaling a bearish trend in motion.
A potential drop in Solana under $140 could fuel the correction phase towards the $105 level, the year-to-date lowest closing price.
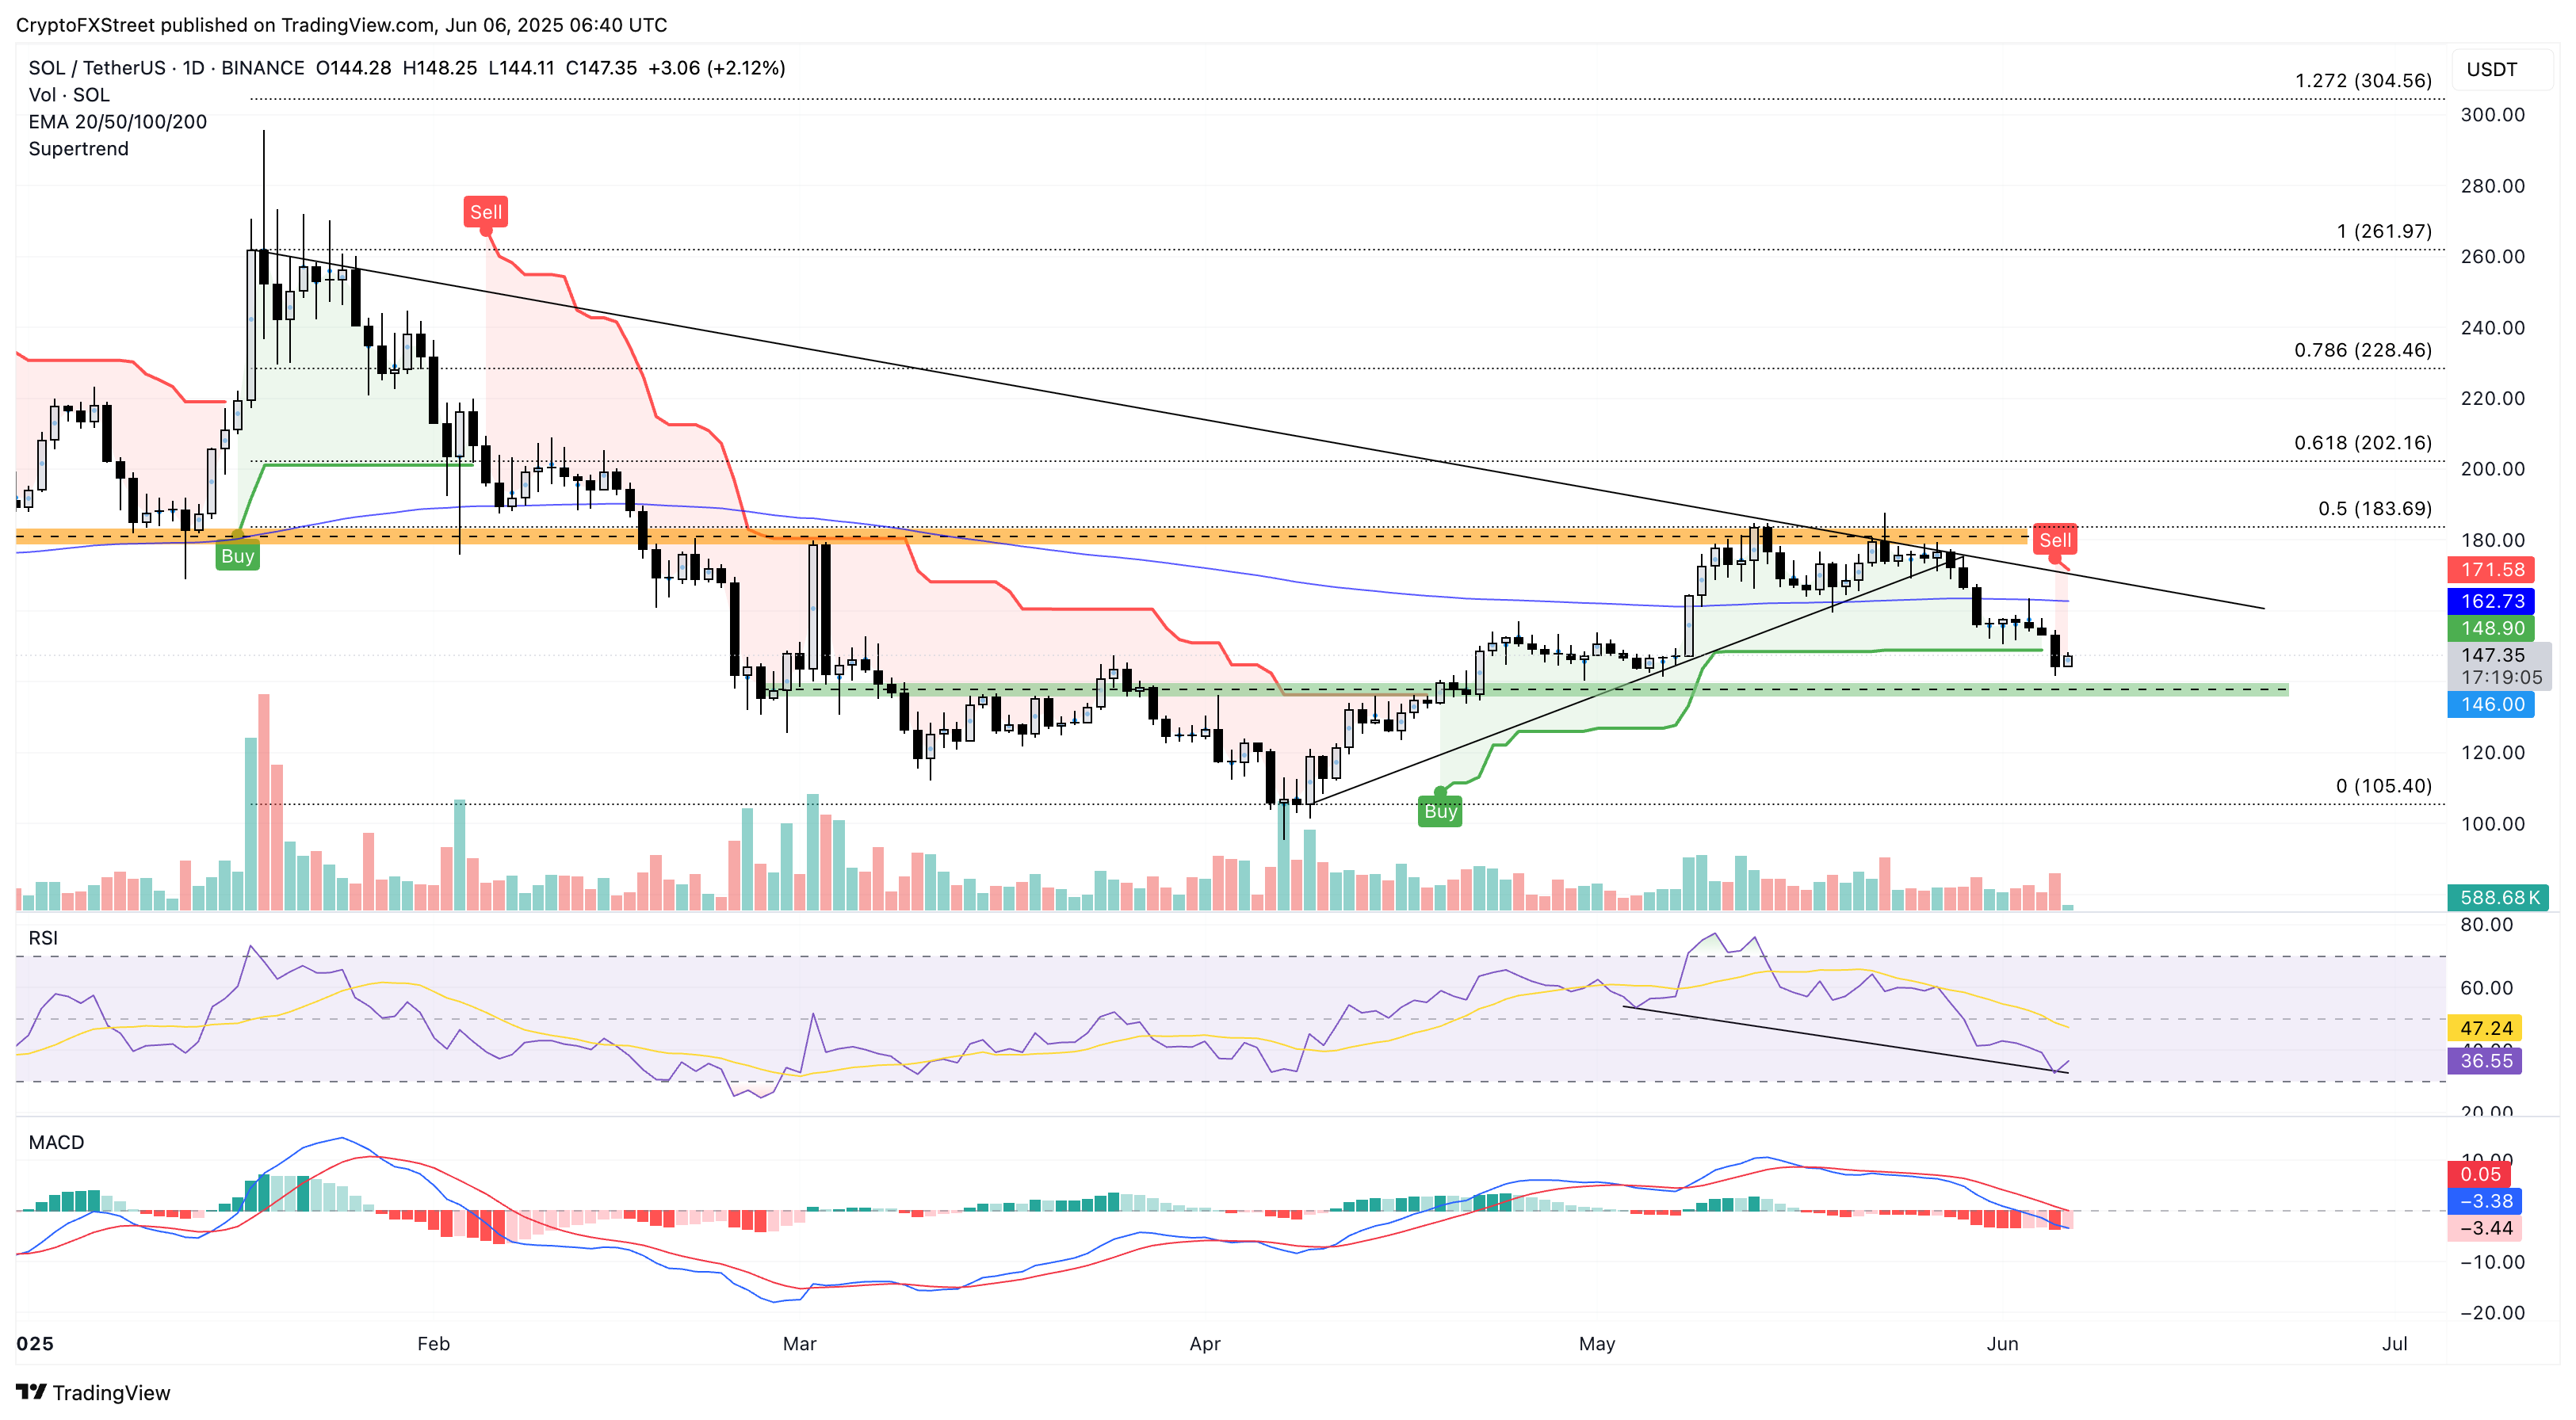
SOL/USDT daily price chart. Source: Tradingview
On the contrary, if Solana extends the intraday recovery, it could face immediate resistance at the 200-day Exponential Moving Average (EMA) at $162.
Read more
* The content presented above, whether from a third party or not, is considered as general advice only. This article should not be construed as containing investment advice, investment recommendations, an offer of or solicitation for any transactions in financial instruments.


