

Silver Price Forecast: XAG/USD extends bull run to near $72.70 as Fed dovish bets remain steady

- Gold Price Forecast: U.S.-Iran Negotiations Face Uncertainties, Gold May Fall Below $4,400
- Gold declines to near $4,500 as renewed US‑Iran tensions, Fed tightening bets weigh
- Gold Falls Below $4,400 for First Time in Two Months. Institutions Lower Gold Price Forecasts as Market Expects PCE to Approach 4%
- Forex Today: Yet to be confirmed US-Iran MOU caps US Dollar's upside
- Bitcoin loses $73,000 as US-Iran escalation, ETF outflows deepen crypto market sell-off
- Gold edges higher above $4,550 on US-Iran peace optimism

Silver price extends rally to near $72.70 amid firm Fed dovish expectations for 2026.
The Fed is expected to cut interest rates by at least 50 bps next year.
The US Q3 GDP unexpectedly grew by 4.3%, faster than the prior reading of 3.8%.
Silver price (XAG/USD) rallies further to near $72.70 during the early European trading session on Wednesday. The white metal extends its bull run as Federal Reserve (Fed) dovish expectations for 2026 remain broadly firm, even as the United States (US) Q3 Gross Domestic Product (GDP) came in surprisingly higher.
According to the CME FedWatch tool, traders see a 70.6% that the Fed will reduce interest rates by at least 50 bps in 2026, signaling a higher scope of interest rate cuts than the Fed’s projections in its dot plot last week. The Fed’s dot plot showed that policymakers collectively see the Federal Funds Rate heading to 3.4% by the end of 2026, indicating that there won’t be more than one interest rate cut.
Theoretically, lower interest rates by the Fed bode well for non-yielding assets, such as Silver.
On Tuesday, the US GDP data showed that the economy grew at a robust pace of 4.3% year-on-year (YoY). Economists expect the US GDP growth to come in lower at 3.3% from 3.8% recorded in the second quarter of the year.
In Wednesday’s session, investors will focus on Initial Jobless Claims data, which will be published at 13:30 GMT. Individuals claiming jobless benefits for the first time are expected to have remained steady at 223K.
Silver technical analysis
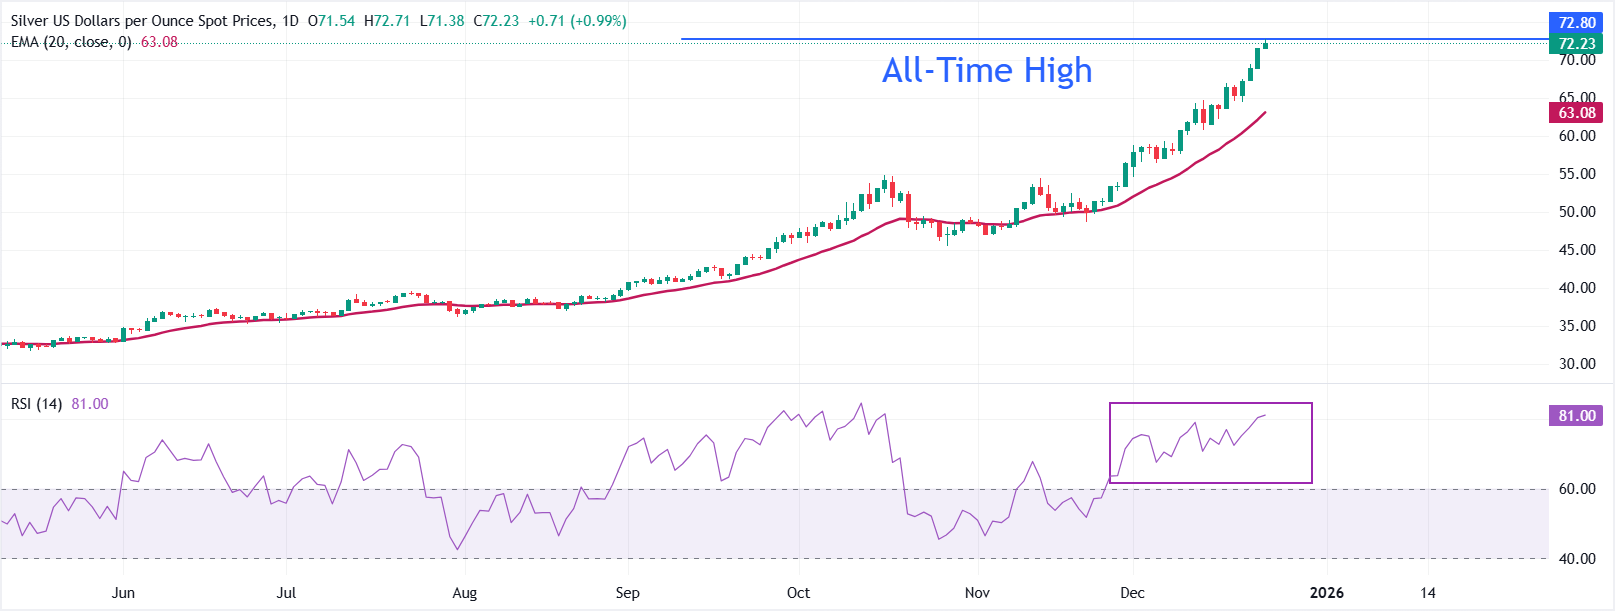
In the daily chart, XAG/USD trades at $72.19. The 20-day exponential moving average is ascending, and price holds well above it, reinforcing a firm bullish bias. The average’s positive slope continues to support the advance. RSI (14) at 80.95 is overbought, signaling stretched momentum that could precede consolidation.
Should momentum cool, pullbacks could find support at the 20-day EMA around $63.07. The uptrend would remain intact while above this dynamic floor, whereas a loss of that level would expose a deeper retracement as overbought conditions unwind.
(The technical analysis of this story was written with the help of an AI tool.)
Read more
* The content presented above, whether from a third party or not, is considered as general advice only. This article should not be construed as containing investment advice, investment recommendations, an offer of or solicitation for any transactions in financial instruments.


