

Sei Price Prediction: SEI is in the zone of interest after a 10% leap

- Gold Price Forecast: Oil Price Breaking $100 Fuels Inflation Concerns, Will Gold Prices Fall Further?
- Gold Price Trend Forecast: Expectations of Easing US-Iran Tensions Boost Gold Prices, $4,070 Becomes Key Level for Bulls and Bears
- Gold rallies to over two-week high, eyes $4,150 as traders track US-Iran diplomacy efforts
- Euro declines to near 1.1400 as US launches fresh strikes on Iran
- Tesla Q2 Earnings Preview: Record Deliveries Fail to Hide Profit Pressure, Can Musk Rely on AI and Autonomous Driving to Unlock New Growth Space?
- WTI climbs above $87.00 as Middle East conflict threatens key choke points

■ Sei price has rallied 10% in the past 24 hours, topping out at $0.6595 on Thursday.
■ SEI could revisit the $0.5000 psychological level, a 25% drop to scale a good comeback opportunity.
■ A candlestick close above $0.8000 would invalidate the bearish thesis.
Sei (SEI) price has been in recovery mode for almost ten days now, following a fall of almost 65% beginning in mid-March. While the SEI bulls continue to show strength, the uptrend could prove premature as massive bearish sentiment hovers above the altcoin’s price.
Sei price rally is premature, one more correction could follow before a breakout
Sei price is up nearly 50% since it bottomed out at $0.4163 on April 14, steered by rising buying momentum as SEI bulls showed up, sending the altcoin past the resistance due to the descending trendline.
While the altcoin is coiling up for a continuation of the trend, selling pressure, which overpowers buyer momentum at current price levels, could compel a correction. Based on the volume nodes on the right, the large spikes in bearish profiles (grey)show that there is massive bearish activity at the current price of SEI token, relative to bullish activity (yellow).
This ratio favoring the bears, coupled with the position of the Relative Strength Index (RSI) below the mean level of 50, and accentuated by the Moving Average Convergence Divergence (MACD) that is in negative territory, suggests a growing short-term bearish sentiment.
If the bears have their way, the Sei price could drop, losing immediate support due to the descending trendline and effective fall below $0.5546 support. An extended fall could see the altcoin descend to tag the $0.5000 threshold, 10% below current levels. In a dire case, SEI could extrapolate the downtrend into the liquidity zone below $0.4683. This would constitute a 25% fall from current levels.
A sweep of this sell-side liquidity on the daily timeframe would provide inflection, balancing the market and propping it up for a recovery. Traders should watch for a lower high on the RSI, which would signify a reversal of the trend.
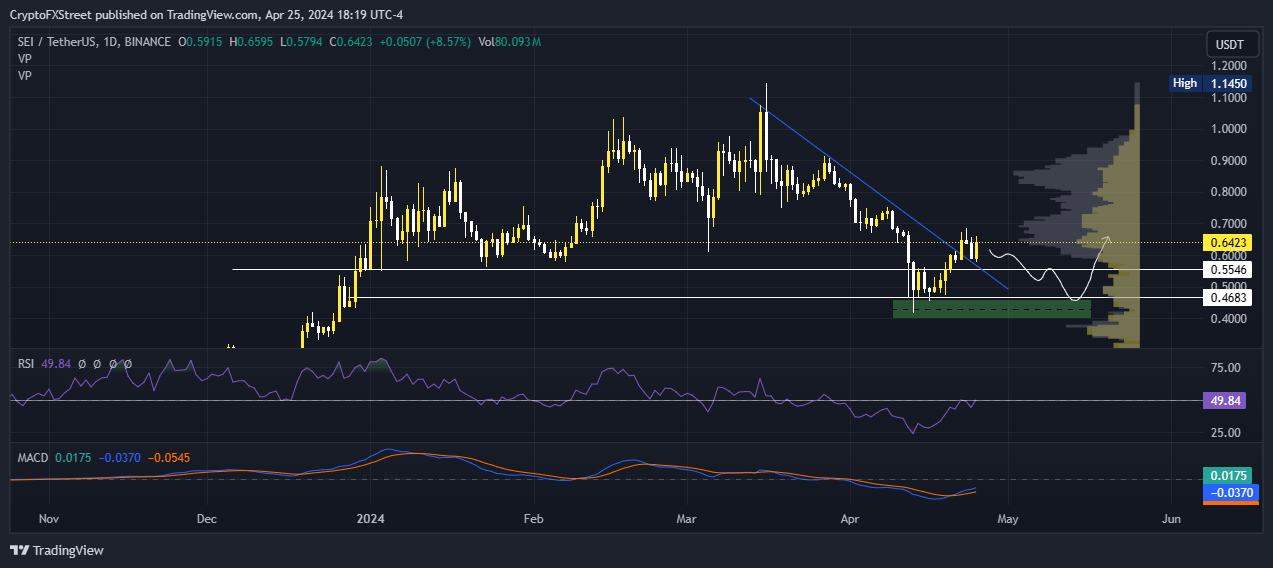
SEI/USDT 1-day chart
On-chain metrics supporting Sei price bearish outlook
Based on Santiment’s data, the social dominance metrics have soared by 116% in four days, moving from 6.93 to 15.00 between April 19 and 25. This metric determines the percentage of mentions of the asset on crypto-related social media relative to a pool of 50 other assets.
The social volume metric has also risen by 50% in the same timeframe, moving from 0.054% to 0.081%. Growth in these metrics is bearish as it tends to inspire FOMO, which often precipitates a reversal. Growing social dominance is viewed as bearish by Santiment. FOMO traders can trigger reversals.
This metric measures the number of mentions of the asset on over a thousand crypto social media channels.
 [01.38.00, 26 Apr, 2024]-638496834517948238.png)
SEI Social dominance, Social volume
The weighted sentiment for SEI has also gone into the negative zone, meaning that bearish sentiment around the token was dominant in the market. The further the extreme (positive or negative) the crowd's sentiment is in one direction, the more likely prices historically move the opposite direction.
This metric is calculated by mixing the overall social volume of an asset (mentions across social media), and the algorithmic measurement of each comment as to whether it is a bullish or bearish comment.
 [01.49.34, 26 Apr, 2024]-638496834748327473.png)
SEI weighted sentiment
On the other hand, increased buying pressure could see SEI price sustain above the descending trendline. A strong move of the RSI above the midline of 50, confirmed by a decisive higher high on this momentum indicator, would confirm a prevailing uptrend.
While a move above the $0.7000 psychological level would be ideal, showing bullish activity having overcome bearish effort, the bearish thesis will only be invalidated once Sei price overcomes bearish activity indicated by the second series of spikes on the volume profile. Effectively, this would mean a candlestick close above $0.8000 in the one-day chart. Such a move would denote a climb of over 40% above current levels.
Read more
* The content presented above, whether from a third party or not, is considered as general advice only. This article should not be construed as containing investment advice, investment recommendations, an offer of or solicitation for any transactions in financial instruments.


