

Cardano Price Forecast: ADA builds bearish momentum amid on-chain weakness

- Trump Blockade of Strait of Hormuz Drives Oil Price Surge, Will This Be Another TACO?
- Silver Price Forecasts: XAG/USD approaches $78.00 boosted by Iran peace hopes
- Nasdaq Index Rises for 10 Straight Days, Why Has Tesla Barely Risen?
- WTI jumps roughly 8% toward $100 as US blockades Strait of Hormuz
- WTI drifts higher to near $89.00 amid Lebanon-Israel ceasefire strains
- AUD/USD climbs above 0.7170 as truce hopes lift risk appetite
Cardano price hovers $0.650 on Tuesday after falling nearly 6% over the last two days.
On-chain data show a bearish picture as funding rates are negative and network activity is falling.
The technical outlook suggests a correction as momentum indicators show bearish signs.
Cardano (ADA) price hovers around $0.650 at the time of writing on Tuesday after falling nearly 6% over the last two days. On-chain data supports the bearish thesis, as funding rates are negative and network activity is falling. The technical outlook suggests a correction, as the momentum indicators, the Relative Strength Index (RSI) and Moving Average Convergence Divergence (MACD) show bearish signs.
Cardano’s network activity and funding rates show a bearish bias
Coinglass's OI-Weighted Funding Rate data shows that the number of traders betting that the price of Cardano will slide further is higher than that anticipating a price increase.
This index is based on the yields of futures contracts, which are weighted by their Open Interest (OI) rates. Generally, a positive rate (longs pay shorts) indicates bullish sentiment, while negative numbers (shorts pay longs) indicate bearishness.
In the case of ADA, the metric stands at -0.0017%, reflecting a negative rate and indicating that shorts are paying longs. This scenario often signifies bearish sentiment in the market, suggesting potential downward pressure on ADA price.
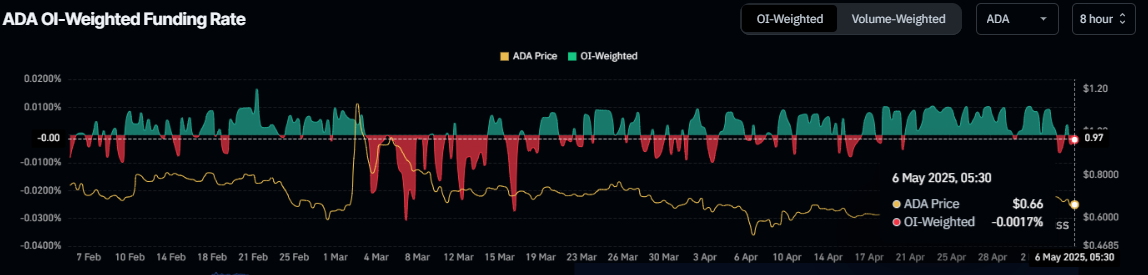
Cardano Funding rate chart. Source: Coinglass
Besides negative funding rates, Coinglass’s Daily Active Addresses index, which tracks network activity over time, also paints a bearish picture for ADA. A rise in the metric signals greater blockchain usage, while declining addresses point to lower demand for the network.
In ADA’s case, Daily Active Addresses have been extending a downtrend starting in early March and reading 21,600 on Tuesday. This indicates that demand for ADA’s blockchain usage is decreasing, which doesn’t bode well for Cardano's price.
 [08-1746504935609.34.16, 06 May, 2025].png)
Cardano daily active addresses chart. Source: Santiment
Cardano Price Forecast: Momentum indicators reflect bearish signals
Cardano price failed to close above the weekly resistance of $0.746 on April 24, leading to a correction of 8.3% over the last 12 days. At the time of writing on Tuesday, it hovers around $0.660.
If ADA continues to correct, it could extend the decline to retest its April 22 low of $0.615.
The RSI on the daily chart reads 46, below its neutral level of 50, indicating bearish momentum. The MACD indicators also show a bearish crossover on Monday, giving sell signals and suggesting a bearish trend.
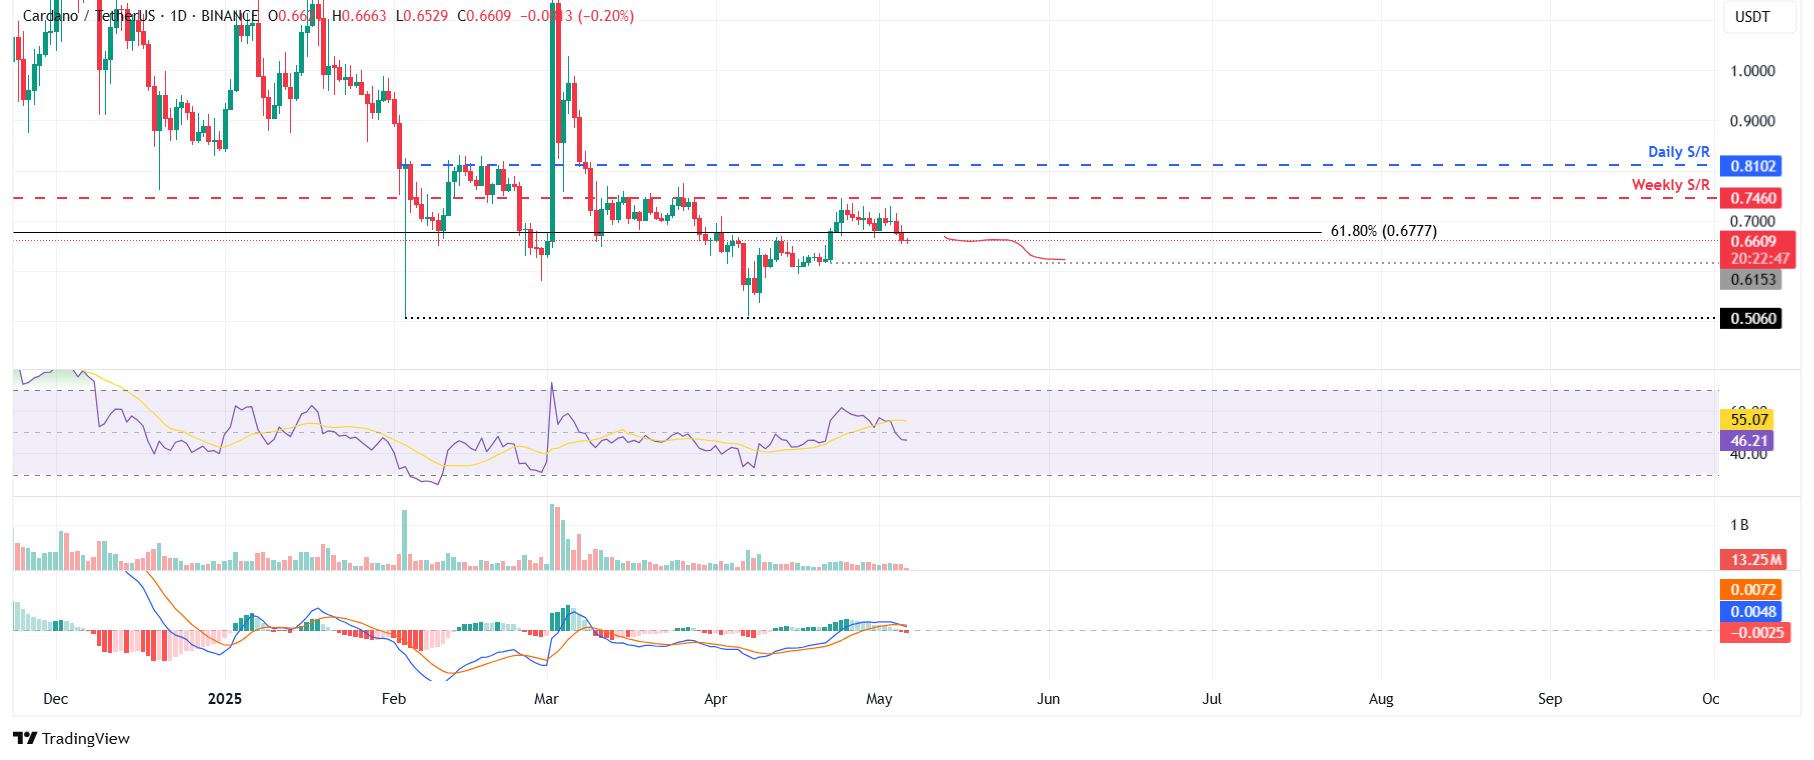
ADA/USDT daily chart
However, if ADA closes above the weekly level of $0.746, it could extend the rally to retest its next daily support at $0.810.
Read more
* The content presented above, whether from a third party or not, is considered as general advice only. This article should not be construed as containing investment advice, investment recommendations, an offer of or solicitation for any transactions in financial instruments.


