
U.S. November CPI: How Will Inflation Fluctuations Transmit to US Stocks? Tariffs Are the Key!
TradingKey - Inflation exerts a notable impact on the stock market. Since the Trump administration took office, it has imposed substantial tariff hikes, and the effects of this policy have gradually filtered through to the inflation level. A high-inflation environment has significantly constrained the Federal Reserve’s room for interest rate cuts, forcing it to scale back the pace of rate reductions—a situation that constitutes a bearish factor for the U.S. stock market. Against this backdrop, the U.S. Consumer Price Index (CPI) data scheduled for release on 18 December serves as a key leading indicator. It should be emphasised that tariff policy is the core driver sustaining the current high level of inflation, and this paper will focus on analysing and forecasting the transmission effects and magnitude of impact of tariff policy on current and next year’s inflation.
Figure: U.S. CPI (%, y-o-y)
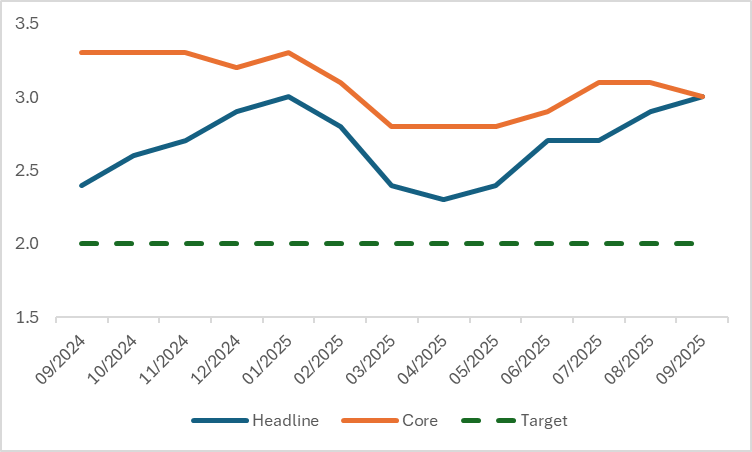
Source: Refinitiv, TradingKey
Our core conclusion is that, based on the judgment of leading indicators, the U.S. November CPI will most likely edge up, and the U.S. stock market will come under pressure as a result. Looking ahead to 2026, the core variable shaping the inflation trajectory will be the transmission effect of tariff policies. Compared with the first round of tariff measures implemented by the Trump administration, the current round of tariff conflicts is more intense, and its pass-through effect on prices is also more pronounced. Driven by this, U.S. inflation is expected to keep climbing in the first half of next year; moving into the second half, alongside the marginal attenuation of tariff shocks, inflation will peak around mid-year and then trend downward. Under the combined influence of tariffs and inflation, the U.S. stock market will probably follow a down-then-up trend in 2026.
November CPI Forecast
The impact of tariffs on inflation has actually been evident for some time. Relevant research from the Federal Reserve shows that high inflation has directly driven up the core goods inflation rate by 0.3 percentage points. According to the recently released September CPI component data, prices of tariff-sensitive goods have generally trended upward: clothing prices rose by 0.7% month-on-month, while prices of furniture and recreational products both increased by 0.4% month-on-month. This set of data indicates that the impact of high tariffs on inflation is still spreading. Based on this judgment, the upcoming November CPI data will also trend upward under the sustained influence of tariff factors.
From the perspective of leading indicators, only food-related indicators are showing a downward trend, while three major categories—energy goods, used cars, and housing—are all sending signals upward. As a forward-looking indicator for core services inflation, average hourly earnings suggest that core services CPI for November will most likely edge up. Based on the above analysis, we believe that the year-on-year growth rate of November CPI will be slightly higher than September’s 3%. Additionally, it should be noted that the U.S. Bureau of Labour Statistics (BLS) has clearly stated that the release of the October CPI report will be suspended due to the disruption of data collection during the previous government shutdown.
Figure: Forecast of November CPI Component Trends
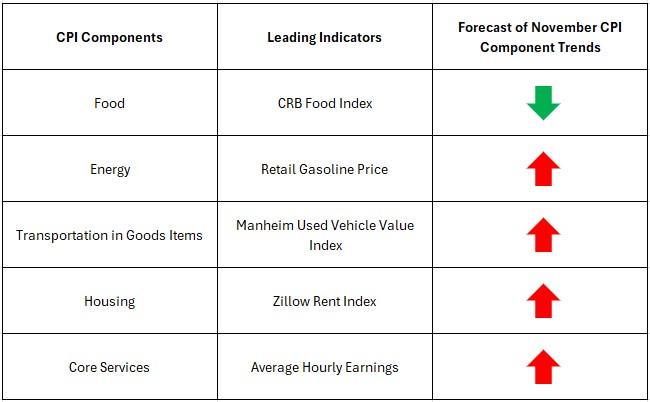
Source: TradingKey
Driven by tariff factors, the uptick in November CPI will dampen market expectations for the Federal Reserve’s interest rate cuts in the first half of next year, thereby exerting downward pressure on U.S. stocks. Against this backdrop, U.S. stocks are unlikely to replicate the seasonal rallies typically seen around Christmas in previous years. Looking ahead to the performance of U.S. stocks in 2026, the changing trend and average level of CPI will emerge as the core variables determining their trajectory.
2026 Inflation Outlook: The Pivotal Role of Tariffs
The trajectory of U.S. inflation next year will hinge squarely on the transmission effect of tariffs. To clarify the current logic underpinning tariffs’ impact, we must look back to Donald Trump’s first presidential term. Between 2017 and 2018, the Trump administration imposed additional tariffs on goods imported from across the globe. While these measures pushed up the prices of certain imported products in the U.S. in the short term, they did not trigger systemic inflation risks. According to a report by the U.S. International Trade Commission (USITC), the tariffs levied under Section 301 from 2017 to 2018 only drove up the prices of domestic U.S. products by 0.2 percentage points. Furthermore, an assessment by the Federal Reserve Bank of Boston on the impact of 2018 tariffs on overall inflation indicated that the tariffs boosted the Federal Reserve’s core PCE price index by a mere 0.1–0.2 percentage points that year. It is evident, therefore, that tariffs exerted a relatively limited influence on inflation during Trump’s initial term in office—a result shaped by the interplay of multiple factors.
First, the total scale of goods subject to tariff hikes during Trump’s first presidential term was relatively limited. Take the China-specific tariff policies implemented between 2017 and 2019 as an example: the value of goods covered by the tariff increases stood at less than $400 billion, while the tariffs imposed on steel and aluminium products applied to goods worth approximately $50 billion. Consequently, the overall impact of these measures on U.S. inflation remained fairly moderate. Second, the U.S. dollar experienced a period of appreciation during the tariff implementation phase. The relative depreciation of non-U.S. currencies offset, to a certain extent, the upward cost pressures stemming from the tariffs.
Third, the rise in import costs triggered by U.S. tariff hikes was not fully passed on to end consumers. Instead, a considerable portion was absorbed internally as exporters, U.S. importers, and distributors squeezed their own profit margins. Fourth, the marginal substitution behaviour of U.S. consumers acted as a buffer: some demand shifted toward non-taxed product categories or domestic alternatives, thereby weakening the intensity of cost pass-through to end prices. Fifth, many U.S. enterprises had already stockpiled goods in advance before the formal implementation of tariff policies, effectively delaying the timeline for tariff-driven shocks to transmit to end prices. Against the backdrop of these five factors, U.S. inflation stayed at around 2% during that period.
Figure: U.S. CPI (%, y-o-y), 2017-2019
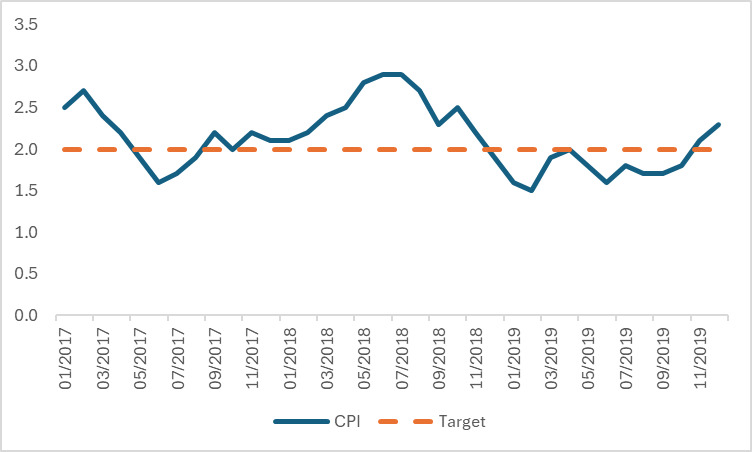
Source: Refinitiv, TradingKey
Compared with the cycle of the Trump administration’s first round of tariff policies, the transmission of inflation in this round of the tariff war only aligns with the 3rd, 4th, and 5th pathways mentioned earlier; the 1st and 2nd pathways are not yet valid at present. Based on this, we judge that the upward effect of tariffs on U.S. inflation will continue to unfold in the first half of 2026, while inflation is expected to peak and decline in the second half of the year. The specific analysis is as follows:
Starting from the spring of 2025, the Trump administration has launched a large-scale tariff imposition. According to Morgan Stanley’s estimates, the U.S. effective tariff rate has surged from 2%–3% at the start of the year to approximately 16% at present. The institution points out that tariffs have driven up inflation by around 0.3 percentage points so far, while the full transmission effect is projected to reach 0.7 percentage points eventually, meaning that the current impact of tariffs on inflation is less than half realised. From the perspective of actual data, commodities heavily impacted by tariffs have seen sustained price increases since the implementation of tariff hike measures, whereas prices of goods less affected by tariffs have remained stable. This phenomenon confirms the reshaping effect of tariffs on commodity prices and inflation. Based on this, we believe that the reflation risk facing the United States in the first half of 2026 warrants close attention.
Nevertheless, after inflation peaks around mid-year next year, it is expected to trend downward month by month. Our judgment that this round of inflation is temporary is based on two main grounds: first, the current inflationary pressure is concentrated in categories heavily impacted by tariffs, has not spread to all commodity categories, and secondary transmission effects such as the wage-price spiral have yet to emerge; second, inflation expectations have remained stable overall, with no obvious signs of unanchoring. Based on this, we believe that the current elevated inflation remains within a controllable range.
The transmission channels through which inflation and tariffs impact U.S. stocks mainly fall into two dimensions. First, the high-inflation environment may cause the Federal Reserve to suspend its interest rate cut process in the first half of next year, and the marginal tightening of market liquidity will suppress the valuation of U.S. stocks. Second, the dual pressures of inflation and tariffs have driven up non-labour costs for enterprises. Although companies can offset such pressures by reducing labour costs and profit margins, they cannot pass on the cost increases to end consumers via price hikes in the short term, which will exert significant pressure on corporate operations. According to U.S. Treasury data, tariff revenues collected over the past 60 days amount to approximately $398 billion on an annualised basis. Compared with the $540 billion in corporate income taxes paid by the corporate sector, the scale of tariffs is by no means negligible. The upward pressure on the cost side will directly constrain corporate profitability and stock price performance.
Therefore, against the combined impact of the reflation process and the high-tariff policy, the U.S. stock market will most likely face a pressured trend in the first half of 2026. Meanwhile, as inflation moderates and tariff shocks gradually ease, coupled with the election of dovish figure Kevin Hassett as Chairman of the Federal Reserve, the U.S. stock market is expected to bottom out and rebound in the second half of 2026.
Conclusion
In summary, based on our forecast for the November CPI, the probability of a sharp rally in U.S. stocks before the end of this year is low. In the first half of 2026, amid the continued unfolding of the high-tariff effect, U.S. inflation is highly likely to keep rising, and U.S. stocks are thus expected to remain under pressure. However, in the second half of the year, as the impact of tariffs gradually fades and inflation moderates, these two factors will jointly drive a bottoming rebound in U.S. stocks.
Recommended Articles


