EUR/USD steadies with all eyes on the ECB monetary policy decision

Source Fxstreet
  • The Euro consolidates near 1.1750 against the US Dollar, halfway through the weekly range.
  • The pair is likely to remain steady ahead of the ECB's monetary policy decision and US CPI data.
  • The ECB is widely expected to leave interest rates unchanged.

EUR/USD posts marginal losses on Thursday, trading near 1.1730 at the time of writing, after bouncing from lows near 1.1700 the previous day. The pair has found some balance halfway through the weekly range after whipsawing earlier in the week.

The highlight of the day will be the outcome of the European Central Bank's (ECB) monetary policy decision. The bank is widely expected to leave its benchmark Rate On the Deposit Facility unchanged at 2% and signal steady monetary policy for the foreseeable future. Any nod to a rate hike on the horizon would be considered a hawkish sign and boost the Euro (EUR) higher.

In the US, investors will be attentive to the release of November's Consumer Price Index (CPI) for further insight about the US Federal Reserve's (Fed) monetary policy plans. Labour data released earlier in the week has been fairly soft, and the risk now is on a moderate inflation reading, which would pave the path for further monetary easing and increase bearish pressure on the US Dollar (USD)

Euro Price Today

The table below shows the percentage change of Euro (EUR) against listed major currencies today. Euro was the strongest against the New Zealand Dollar.

USD EUR GBP JPY CAD AUD NZD CHF
USD 0.08% 0.09% 0.08% -0.04% -0.07% 0.17% -0.00%
EUR -0.08% -0.00% 0.00% -0.13% -0.15% 0.09% -0.09%
GBP -0.09% 0.00% -0.02% -0.13% -0.16% 0.08% -0.10%
JPY -0.08% 0.00% 0.02% -0.12% -0.14% 0.07% -0.08%
CAD 0.04% 0.13% 0.13% 0.12% -0.02% 0.21% 0.03%
AUD 0.07% 0.15% 0.16% 0.14% 0.02% 0.24% 0.06%
NZD -0.17% -0.09% -0.08% -0.07% -0.21% -0.24% -0.18%
CHF 0.00% 0.09% 0.10% 0.08% -0.03% -0.06% 0.18%

The heat map shows percentage changes of major currencies against each other. The base currency is picked from the left column, while the quote currency is picked from the top row. For example, if you pick the Euro from the left column and move along the horizontal line to the US Dollar, the percentage change displayed in the box will represent EUR (base)/USD (quote).

Daily Digest Market Movers: Euro remains supported by ECB-Fed divergence

  • The Euro downside attempts remain limited so far, with the EUR/USD pair trading near three-month highs as investors anticipate further interest rate cuts by the Fed, while, in the ECB, the next move is likely to be a rate hike.
  • The European Central Bank will, most likely, leave interest rates on hold for the fourth consecutive meeting and stick to the "meeting-by-meeting" rhetoric. Investors, however, will be attentive to the bank's economic growth forecasts, amid growing speculation about the possibility of a rate hike in the second half of 2026.
  • The Fed, on the contrary, is immersed in its easing cycle, which, according to US President Donald Trump, might have a long way to go. Trump said on Wednesday that he will soon announce the name of the next Fed Chairman and that it will be someone who believes in lowering borrowing costs "by a lot".
  • With those comments in the review, the market will be particularly attentive to the November US Consumer Price Index (CPI) figures, due later on Thursday. Consumer inflation is expected to have ticked up to a 3.1% year-on-year rate in November from September's 3.0%. October's reading will not be released because the US government shutdown discontinued data collection.
  • On Wednesday, Eurostat revised the Eurozone's November Harmonized Index of Consumer Prices (HICP) growth to 2.1% year-on-year, from the 2.2% previously estimated. The core HICP was left unchanged at a 2.4% yearly growth.
  • Also on Wednesday, German IFO data showed that the business climate deteriorated for the second consecutive month in December. The headline indicator eased to 87.6 from 88.0 in November, against the market consensus of a moderate improvement to 88.2. The index measuring the sentiment about the current economic situation remained unchanged at 85.6, below market expectations of 85.7, while the Expectations index dropped to 89.7 from 90.5. The market consensus had anticipated a steady reading.
  • In the US, Fed officials continued highlighting their divergences. Governor Christopher Waller, one of Trump's favourite candidates to replace Jerome Powell, said that the central bank has room to cut interest rates further. On the hawkish side, Atlanta Fed President Raphael Bostic warned about excessive monetary easing amid the lingering inflationary pressures.

Technical Analysis: EUR/USD maintains its bullish bias with bears halted at 1.1700

EUR/USD Chart
EUR/USD 4-Hour Chart


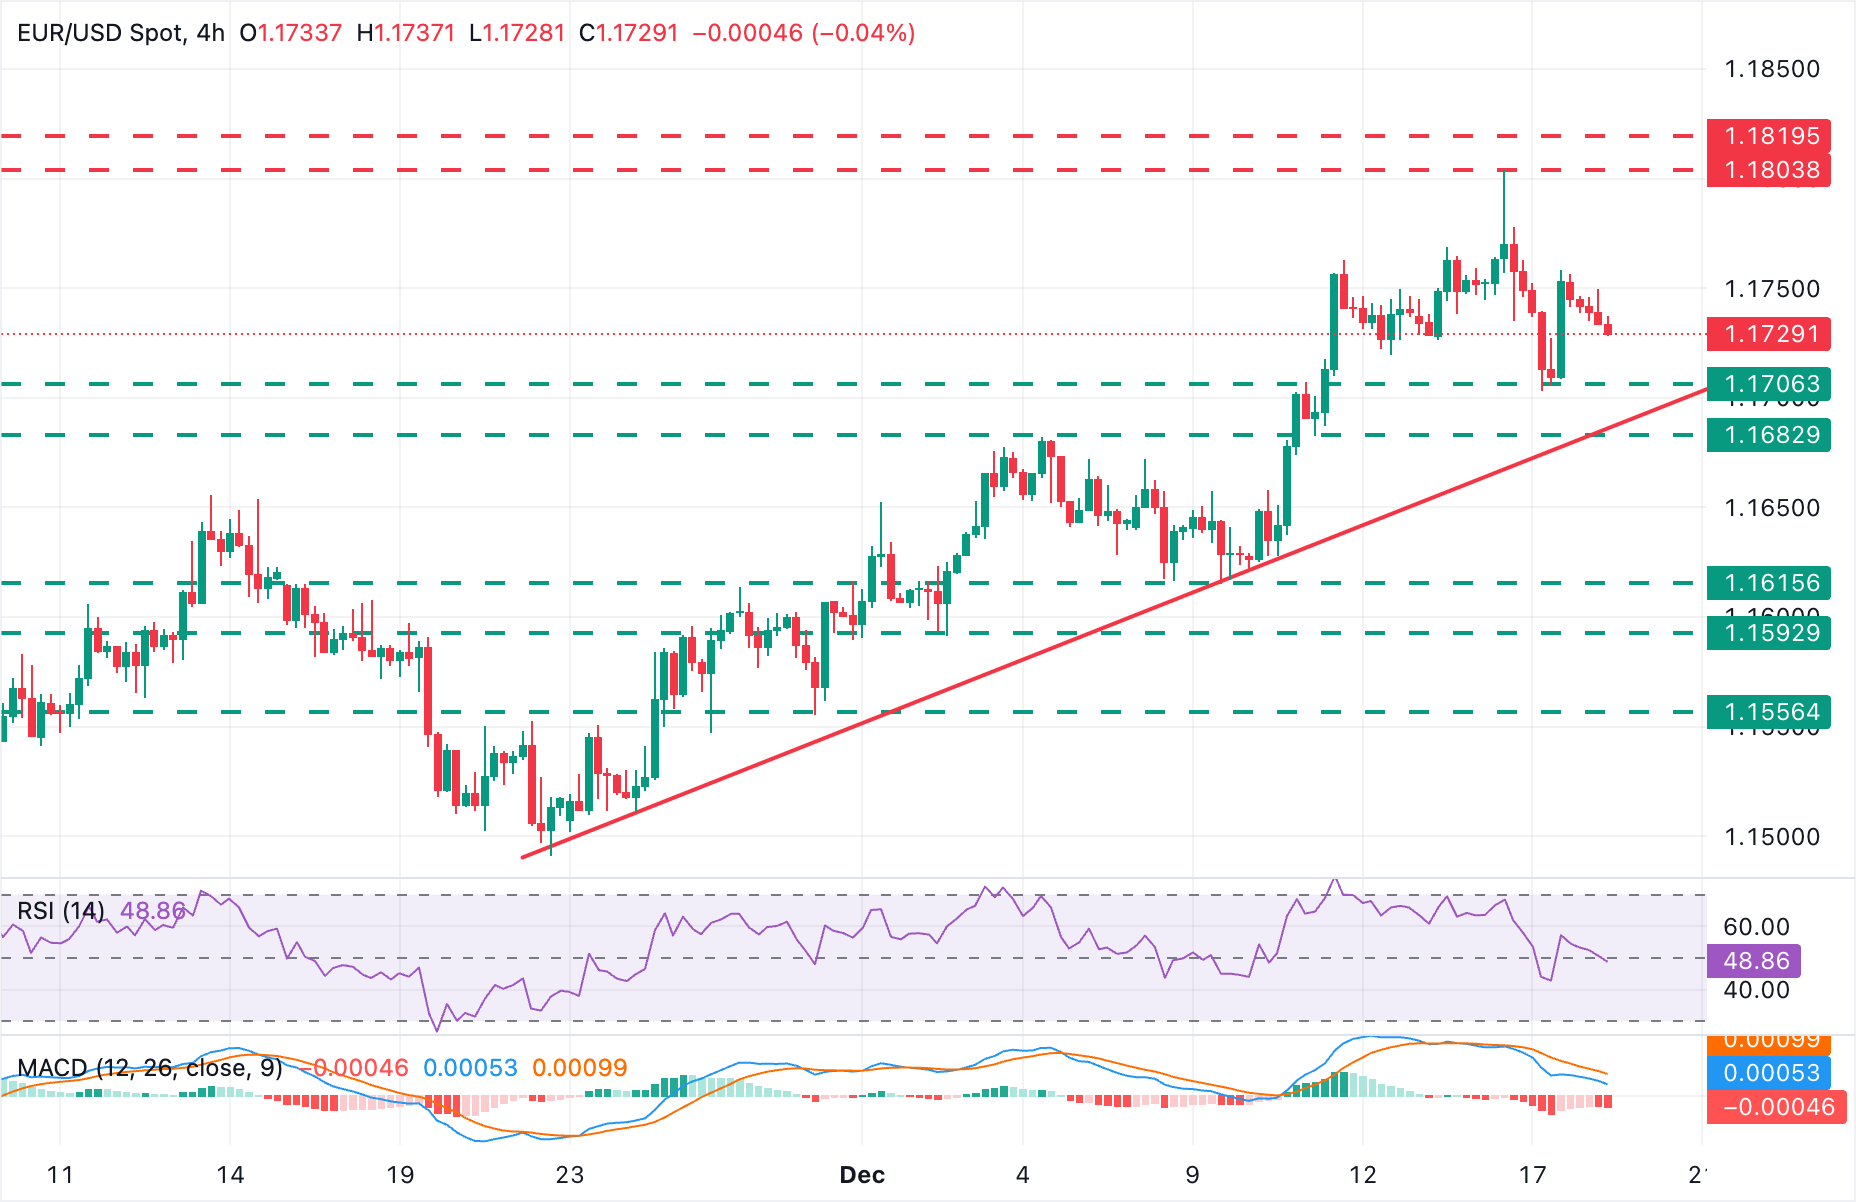
The EUR/USD pair keeps the broader bullish bias intact, as the correction from 1.1800 highs has been contained above 1.1700. On Thursday, the 4-hour Relative Strength Index (RSI) has returned to bullish territory above the 50 level, and the Moving Average Convergence Divergence (MACD) indicator is showing shallower red histogram bars.

Immediate support is at Wednesday's low near 1.1700 ahead of an important area near 1.1685, where a trendline support converges with the December 11 low and the December 4 high. A confirmation below this level would cancel the bullish view and bring the December 9 low, at 1.1615, into focus.

To the upside, the intraday high, near 1.1760, is likely to challenge bulls ahead of Wednesday's peak, at 1.1804, and the September 23 and 24 highs, near 1.1820.

ECB FAQs

The European Central Bank (ECB) in Frankfurt, Germany, is the reserve bank for the Eurozone. The ECB sets interest rates and manages monetary policy for the region. The ECB primary mandate is to maintain price stability, which means keeping inflation at around 2%. Its primary tool for achieving this is by raising or lowering interest rates. Relatively high interest rates will usually result in a stronger Euro and vice versa. The ECB Governing Council makes monetary policy decisions at meetings held eight times a year. Decisions are made by heads of the Eurozone national banks and six permanent members, including the President of the ECB, Christine Lagarde.

In extreme situations, the European Central Bank can enact a policy tool called Quantitative Easing. QE is the process by which the ECB prints Euros and uses them to buy assets – usually government or corporate bonds – from banks and other financial institutions. QE usually results in a weaker Euro. QE is a last resort when simply lowering interest rates is unlikely to achieve the objective of price stability. The ECB used it during the Great Financial Crisis in 2009-11, in 2015 when inflation remained stubbornly low, as well as during the covid pandemic.

Quantitative tightening (QT) is the reverse of QE. It is undertaken after QE when an economic recovery is underway and inflation starts rising. Whilst in QE the European Central Bank (ECB) purchases government and corporate bonds from financial institutions to provide them with liquidity, in QT the ECB stops buying more bonds, and stops reinvesting the principal maturing on the bonds it already holds. It is usually positive (or bullish) for the Euro.


Disclaimer: For information purposes only. Past performance is not indicative of future results.
placeholder
Gold Price Forecast: XAU/USD drifts higher above $4,200 as Fed delivers expected cutGold price (XAU/USD) gains momentum to around $4,235 during the early Asian session on Thursday. The precious metal extends its upside after the US Federal Reserve (Fed) delivered an expected third consecutive interest rate cut and maintained its outlook for just one cut in 2026.
Author  FXStreet
Dec 11, Thu
Gold price (XAU/USD) gains momentum to around $4,235 during the early Asian session on Thursday. The precious metal extends its upside after the US Federal Reserve (Fed) delivered an expected third consecutive interest rate cut and maintained its outlook for just one cut in 2026.
placeholder
Ethereum Price Slips Lower — $3,000 Looms as the Key BattlegroundEthereum is attempting to recover from a $3,026 low but remains below $3,200 and the 100-hour SMA, with a bearish trend line near $3,175 capping rebounds as bulls need a clean break above $3,200 to target $3,250–$3,400, while a drop below $3,050 risks a retest of $3,000 and $2,940.
Author  Mitrade
Dec 15, Mon
Ethereum is attempting to recover from a $3,026 low but remains below $3,200 and the 100-hour SMA, with a bearish trend line near $3,175 capping rebounds as bulls need a clean break above $3,200 to target $3,250–$3,400, while a drop below $3,050 risks a retest of $3,000 and $2,940.
placeholder
Bitcoin Slides 5% as Sellers Lean In — Can BTC Reclaim $88,000?Bitcoin has dropped back below $88,000 after rolling over from $90,500, with price still trading under the 100-hour Simple Moving Average. The sell-off found a floor at $85,151, and BTC is now consolidating near that base, but rebounds are facing pressure from a bearish trend line around $89,000. Bulls need to retake $88,000–$89,000 to ease downside risk; failure to do so keeps $85,500–$85,000 and then $83,500 in play, with $80,000 as the deeper “line in the sand.” Bitcoin (BTC) is back in damage-control mode after a sharp pullback wiped out recent gains. The price failed to reclaim the $90,000–$90,500 band, rolled over, and slid through $88,500 before briefly dipping under $87,000. Buyers did show up around $85,000, but the rebound so far looks more like stabilization than a clear trend reversal. Bitcoin dips hard, finds a bid near $85,000(h3) BTC’s latest move lower began when it couldn’t build follow-through above $90,000 and $90,500. Once that upside stalled, sellers took control and pushed price down through $88,500. The slide accelerated enough to spike below $87,000, but the market didn’t free-fall. Bulls defended the $85,000 zone, printing a low at $85,151. Since then, Bitcoin has been consolidating below the 23.6% Fibonacci retracement of the drop from the $93,560 swing high to the $85,151 low — a clue that the bounce is still shallow and that sellers haven’t fully backed off yet. Structurally, BTC is still on the back foot: It’s trading below $88,000, and It remains below the 100-hour Simple Moving Average, keeping short-term trend pressure pointed downward. Resistance is layered, and $89,000 is the problem area(h3) If bulls try to turn this into a recovery, they’ll have to climb through multiple ceilings in quick succession. First, BTC faces resistance around $87,150, followed by a more meaningful barrier near $87,500. From there, the market’s attention snaps back to $88,000 — the level BTC just lost and now needs to reclaim. A close back above $88,000 would improve the tone, but it doesn’t solve the bigger issue: there’s a bearish trend line on the hourly BTC/USD chart (Kraken feed) with resistance near $89,000, which also lines up with the next technical hurdle. If BTC can push through $89,000 and hold, the rebound could extend toward $90,000, with follow-through targets at $91,000 and $91,500. But until price clears that $88,000–$89,000 zone, rallies are at risk of being sold rather than chased. If BTC fails to reclaim resistance, the downside path is clear(h3) The near-term bear case is simple: if Bitcoin can’t climb back above the $87,000 area and keep traction, sellers may attempt another leg lower. Support levels line up like this: Immediate support: $85,500 First major support: $85,000 Next support: $83,500 Then $82,500 in the near term Below that, the major “don’t break this” level is still $80,000. If BTC slips under $80,000, the risk of acceleration to the downside increases significantly — not because it’s magic, but because it’s the kind of psychological and structural level that tends to trigger forced de-risking. Indicators: momentum still leans bearish(h3) The intraday indicators aren’t offering much comfort yet: Hourly MACD is losing pace in the bearish zone. Hourly RSI remains below 50, suggesting sellers still have the upper hand on short timeframes. So while the $85,000 defense held for now, the market hasn’t flipped bullish — it’s just stopped bleeding.
Author  Mitrade
Dec 16, Tue
Bitcoin has dropped back below $88,000 after rolling over from $90,500, with price still trading under the 100-hour Simple Moving Average. The sell-off found a floor at $85,151, and BTC is now consolidating near that base, but rebounds are facing pressure from a bearish trend line around $89,000. Bulls need to retake $88,000–$89,000 to ease downside risk; failure to do so keeps $85,500–$85,000 and then $83,500 in play, with $80,000 as the deeper “line in the sand.” Bitcoin (BTC) is back in damage-control mode after a sharp pullback wiped out recent gains. The price failed to reclaim the $90,000–$90,500 band, rolled over, and slid through $88,500 before briefly dipping under $87,000. Buyers did show up around $85,000, but the rebound so far looks more like stabilization than a clear trend reversal. Bitcoin dips hard, finds a bid near $85,000(h3) BTC’s latest move lower began when it couldn’t build follow-through above $90,000 and $90,500. Once that upside stalled, sellers took control and pushed price down through $88,500. The slide accelerated enough to spike below $87,000, but the market didn’t free-fall. Bulls defended the $85,000 zone, printing a low at $85,151. Since then, Bitcoin has been consolidating below the 23.6% Fibonacci retracement of the drop from the $93,560 swing high to the $85,151 low — a clue that the bounce is still shallow and that sellers haven’t fully backed off yet. Structurally, BTC is still on the back foot: It’s trading below $88,000, and It remains below the 100-hour Simple Moving Average, keeping short-term trend pressure pointed downward. Resistance is layered, and $89,000 is the problem area(h3) If bulls try to turn this into a recovery, they’ll have to climb through multiple ceilings in quick succession. First, BTC faces resistance around $87,150, followed by a more meaningful barrier near $87,500. From there, the market’s attention snaps back to $88,000 — the level BTC just lost and now needs to reclaim. A close back above $88,000 would improve the tone, but it doesn’t solve the bigger issue: there’s a bearish trend line on the hourly BTC/USD chart (Kraken feed) with resistance near $89,000, which also lines up with the next technical hurdle. If BTC can push through $89,000 and hold, the rebound could extend toward $90,000, with follow-through targets at $91,000 and $91,500. But until price clears that $88,000–$89,000 zone, rallies are at risk of being sold rather than chased. If BTC fails to reclaim resistance, the downside path is clear(h3) The near-term bear case is simple: if Bitcoin can’t climb back above the $87,000 area and keep traction, sellers may attempt another leg lower. Support levels line up like this: Immediate support: $85,500 First major support: $85,000 Next support: $83,500 Then $82,500 in the near term Below that, the major “don’t break this” level is still $80,000. If BTC slips under $80,000, the risk of acceleration to the downside increases significantly — not because it’s magic, but because it’s the kind of psychological and structural level that tends to trigger forced de-risking. Indicators: momentum still leans bearish(h3) The intraday indicators aren’t offering much comfort yet: Hourly MACD is losing pace in the bearish zone. Hourly RSI remains below 50, suggesting sellers still have the upper hand on short timeframes. So while the $85,000 defense held for now, the market hasn’t flipped bullish — it’s just stopped bleeding.
placeholder
December Santa Claus Rally: New highs in sight for US and European stocks?Historical data show a rising trend of US and European stocks in December. If the momentum is strong, fund managers may rush in with a buying frenzy.
Author  Mitrade
Yesterday 02: 50
Historical data show a rising trend of US and European stocks in December. If the momentum is strong, fund managers may rush in with a buying frenzy.
placeholder
XRP’s Price Action Flashes a Warning Even as ETF Flows Stay PositiveXRP’s structure remains weak despite 18 straight positive closes in spot XRP ETFs, with analysts warning that $1.98 and other nearby resistance zones could cap rebounds unless the YO region is reclaimed, while deeper downside scenarios keep $1.53 on watch as a potential (not guaranteed) accumulation area.
Author  Mitrade
Yesterday 06: 37
XRP’s structure remains weak despite 18 straight positive closes in spot XRP ETFs, with analysts warning that $1.98 and other nearby resistance zones could cap rebounds unless the YO region is reclaimed, while deeper downside scenarios keep $1.53 on watch as a potential (not guaranteed) accumulation area.
goTop
quote