Ethereum (ETH) Struggles To Hit $2,000 With Weak Whale Accumulation

Mitrade
coverImg
Source: DepositPhotos

Ethereum (ETH) has been struggling, down nearly 30% over the past 30 days as bearish sentiment continues to weigh on the asset. Over the last week, ETH has remained stuck below the $2,000 mark, unable to regain key resistance levels.


While some indicators, like BBTrend, are showing early signs of stabilization, whale activity points to cautious behavior among large investors. As Ethereum trades near critical support zones, the market is watching closely to see if the downtrend will deepen or if bulls can stage a meaningful recovery.


BBTrend Is Now Positive After 6 Days, But Still At Modest Levels


Ethereum’s BBTrend indicator is currently sitting at 0.22, having just turned positive after spending six consecutive days in negative territory.


During that stretch, it reached a negative peak of -17.68 on March 13, reflecting strong bearish momentum.


This shift marks a potential early sign of stabilization for Ethereum. The indicator has crossed back above zero, signaling that sellers may be losing control in the short term, as Ethereum network activity recently hit yearly lows.
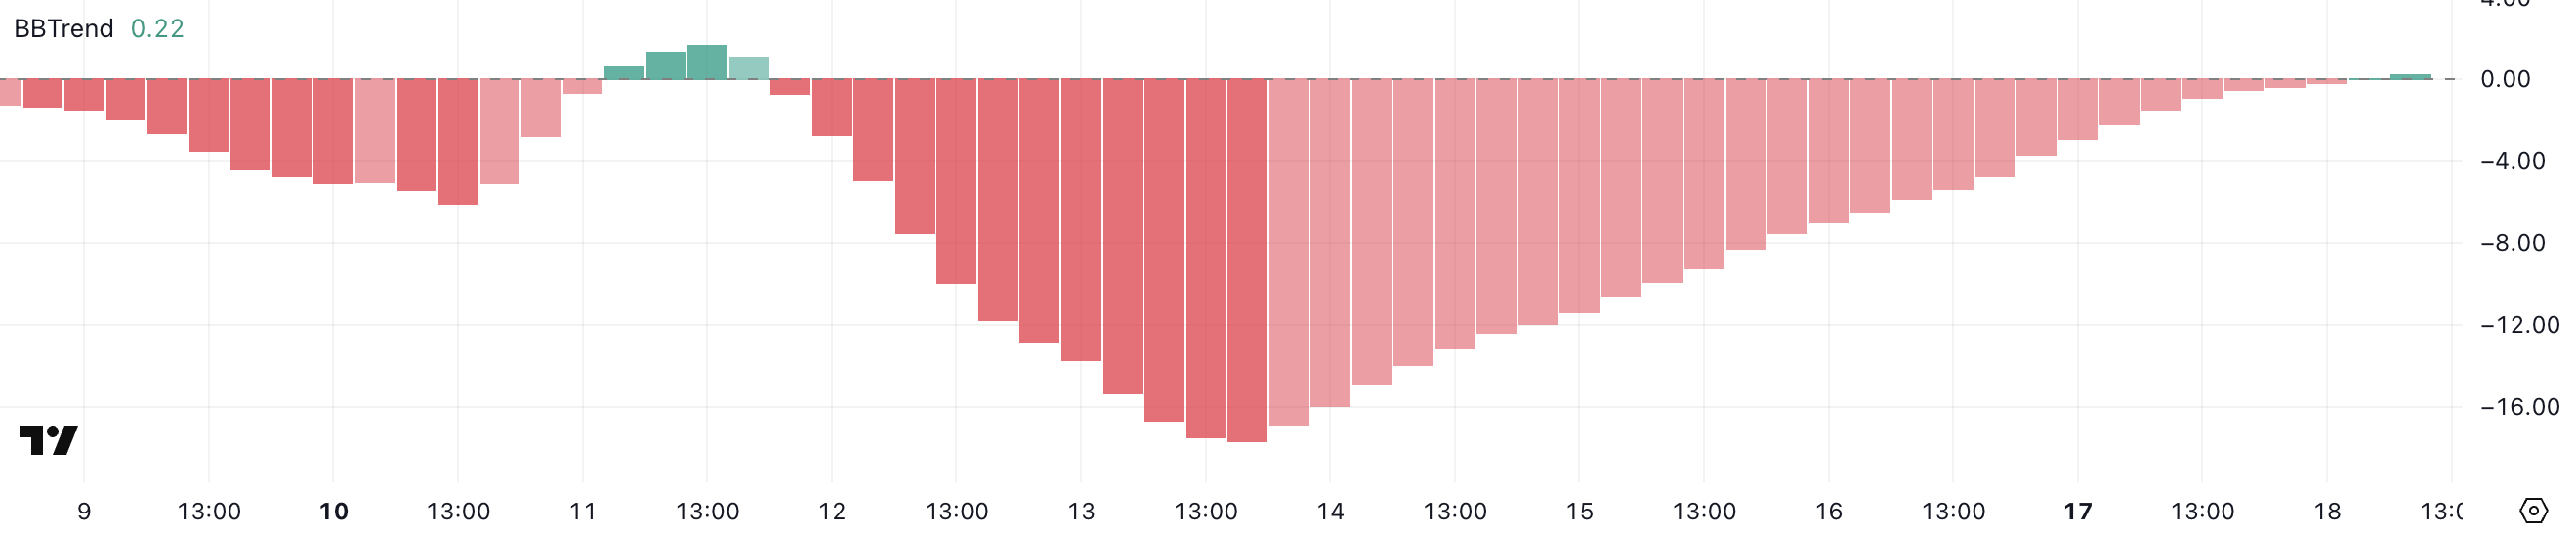

ETH BBTrend.ETH BBTrend. Source: TradingView.


BBTrend, or Bollinger Band Trend, is a momentum-based indicator that measures the strength and direction of a price trend relative to its Bollinger Bands. Readings below 0 typically suggest bearish conditions, while readings above 0 indicate bullish momentum.


Thresholds around -10 or +10 often highlight periods of stronger trend conviction. Ethereum’s BBTrend is now back in positive territory after a prolonged bearish phase, suggesting that downward pressure is easing.


However, at just 0.22, the indicator is still at low levels, signaling that while the sell-off might be cooling, the market has yet to transition into a strong bullish trend fully.

Whales Are Not Accumulating Ethereum


The number of Ethereum whales—wallets holding at least 1,000 ETH—has been steadily declining since February 22, after peaking at 5,828 addresses.

The current number of Ethereum whales stands at 5,752, despite a modest attempt at a rebound in recent days, with Ethereum market dominance hitting its lowest levels since 2020.


This gradual reduction in large holders points to a cautious approach among key players. Some whales are reducing their exposure or taking profits as Ethereum’s price action remains mixed.
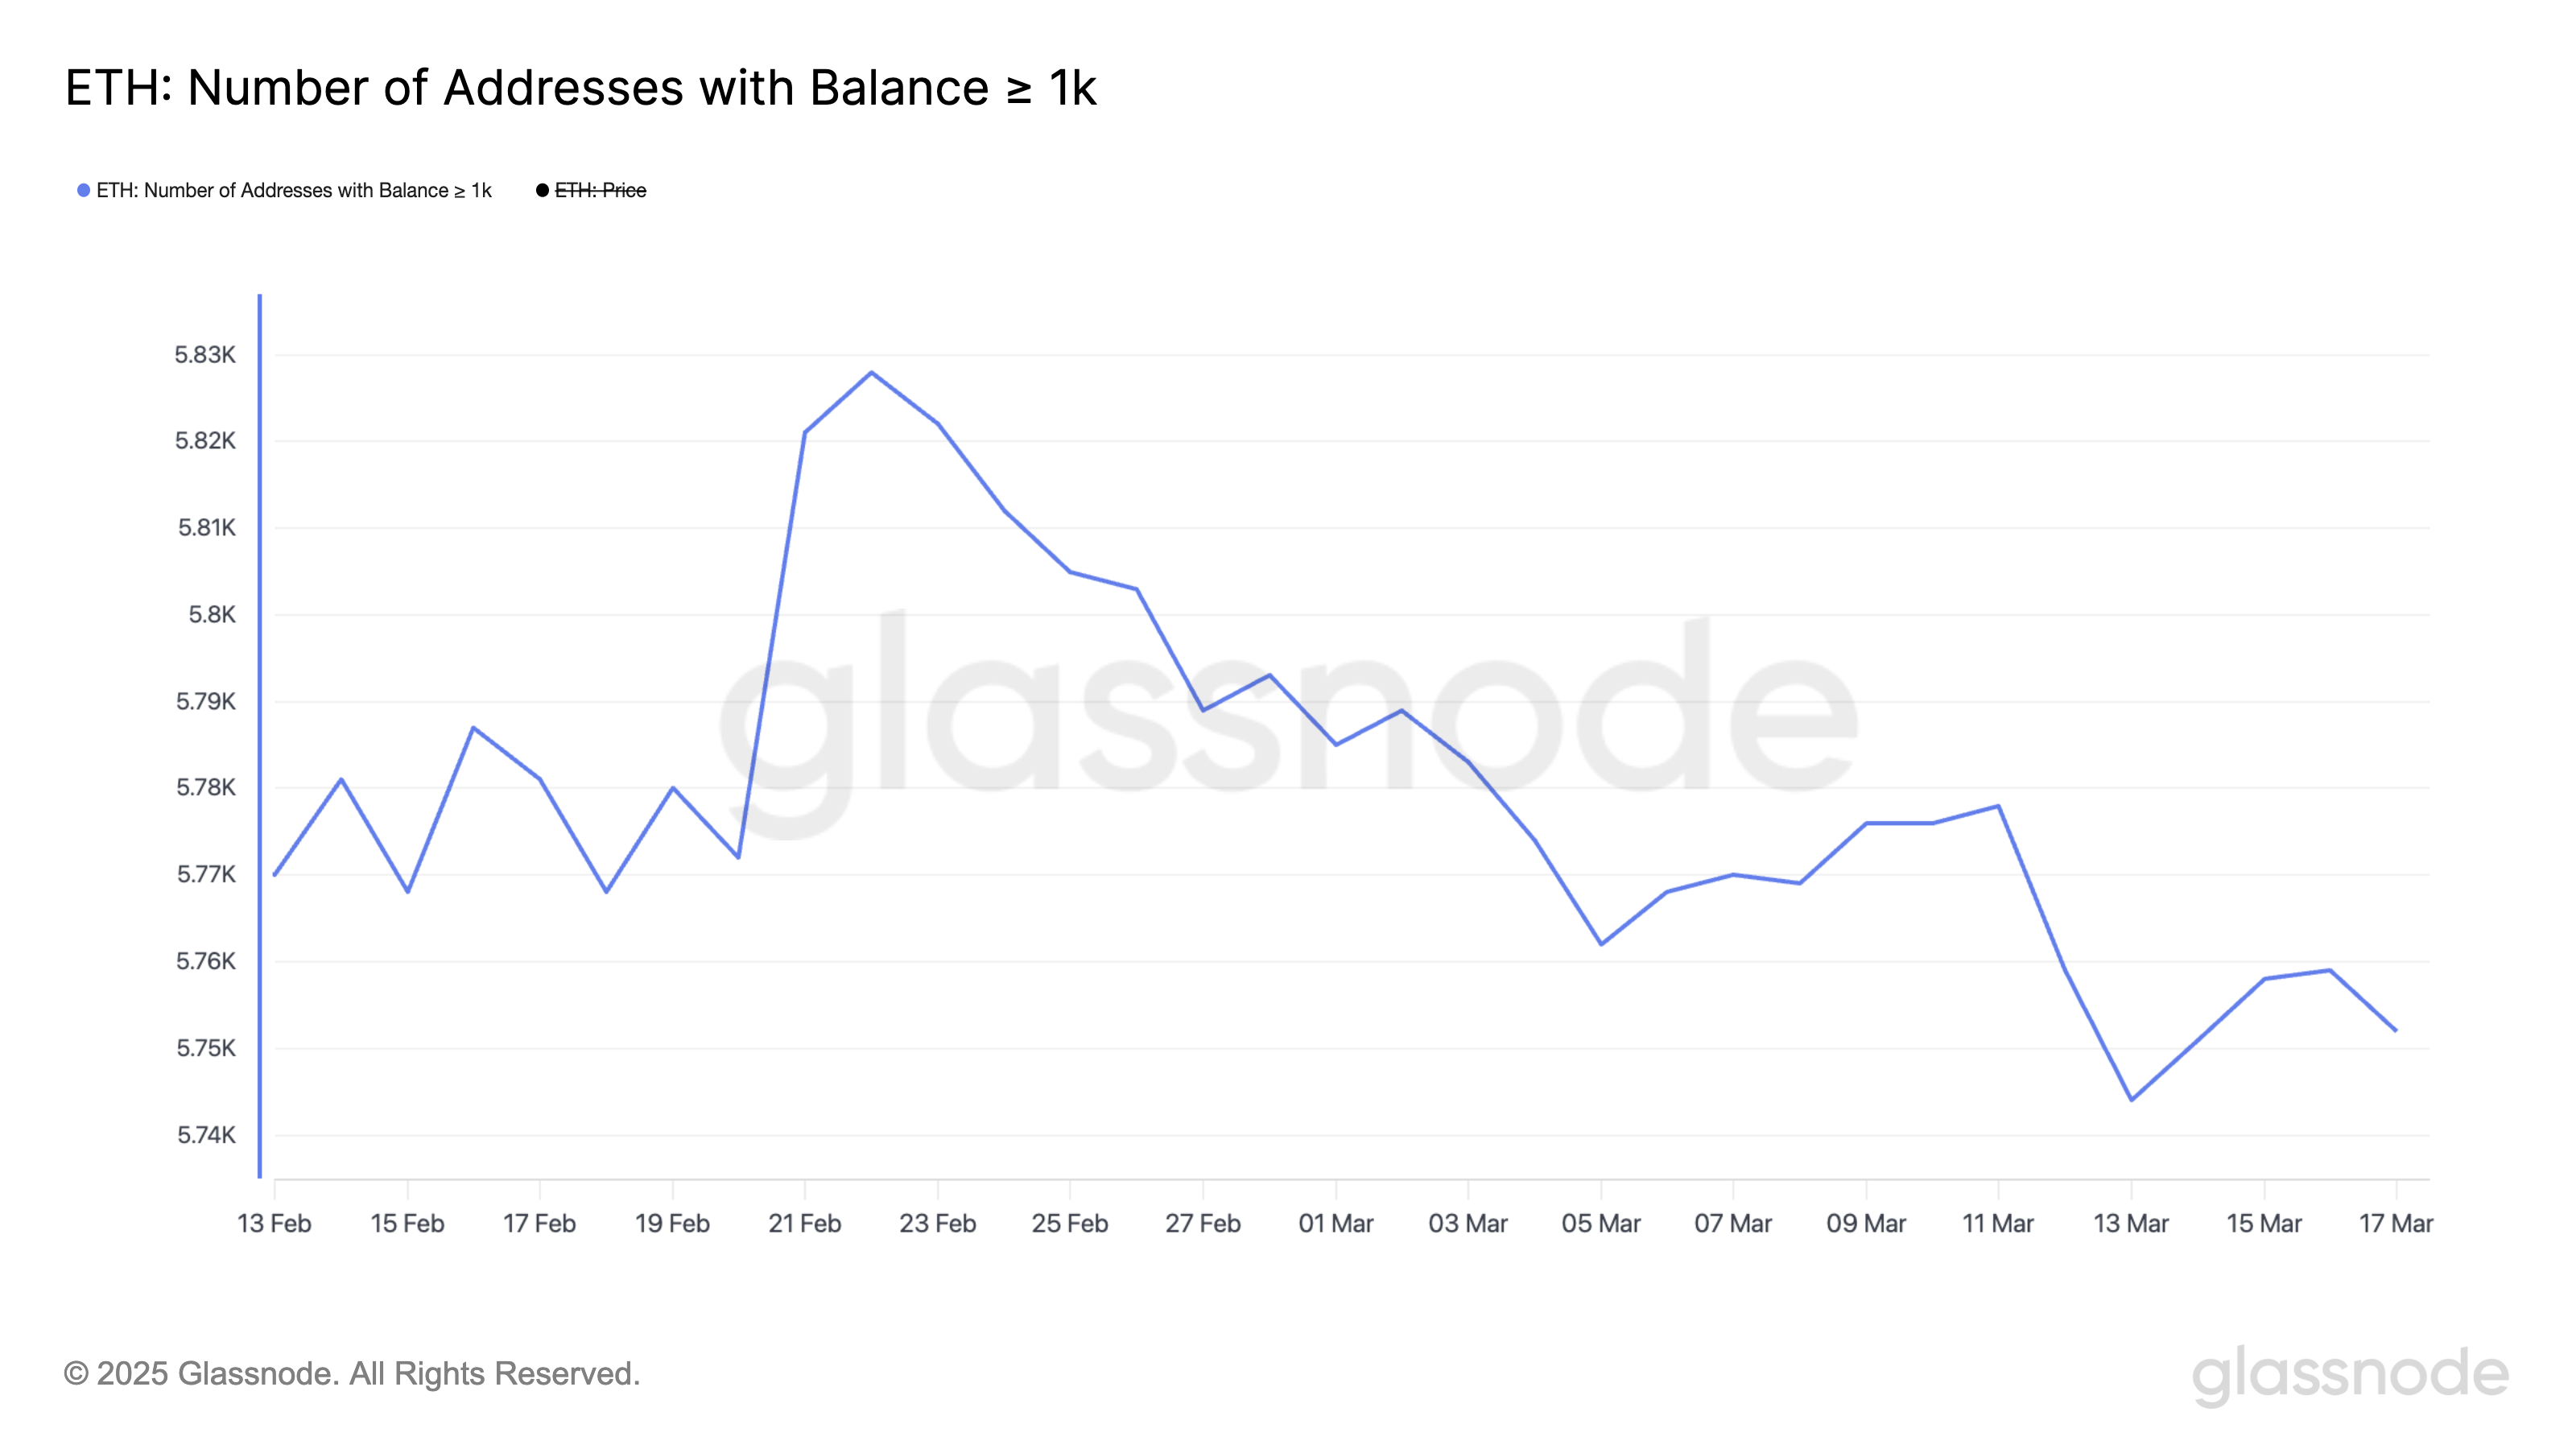
ETH Whales.ETH Whales. Source: Glassnode.


Tracking whale behavior is crucial because these large addresses often act as market movers, capable of influencing price trends through their buying or selling activity.


A steady decline in Ethereum whale numbers may suggest waning confidence or a shift toward risk-off sentiment among institutional or high-net-worth investors.


This downward trend in whale accumulation could limit the strength of any potential rallies, as fewer large players are positioned to provide strong buying support in the short term.


Will Ethereum Fall Below $1,700 In March?


Ethereum has been under pressure, trading below the $2,000 mark for the past seven days. Sellers have kept the asset pinned beneath key resistance levels.

The current support stands at $1,823, and if this level is tested and broken, Ethereum could decline further toward $1,759 and potentially fall below $1,700 for the first time since October 2023, despite some experts defending its future echoes early Amazon and Microsoft.
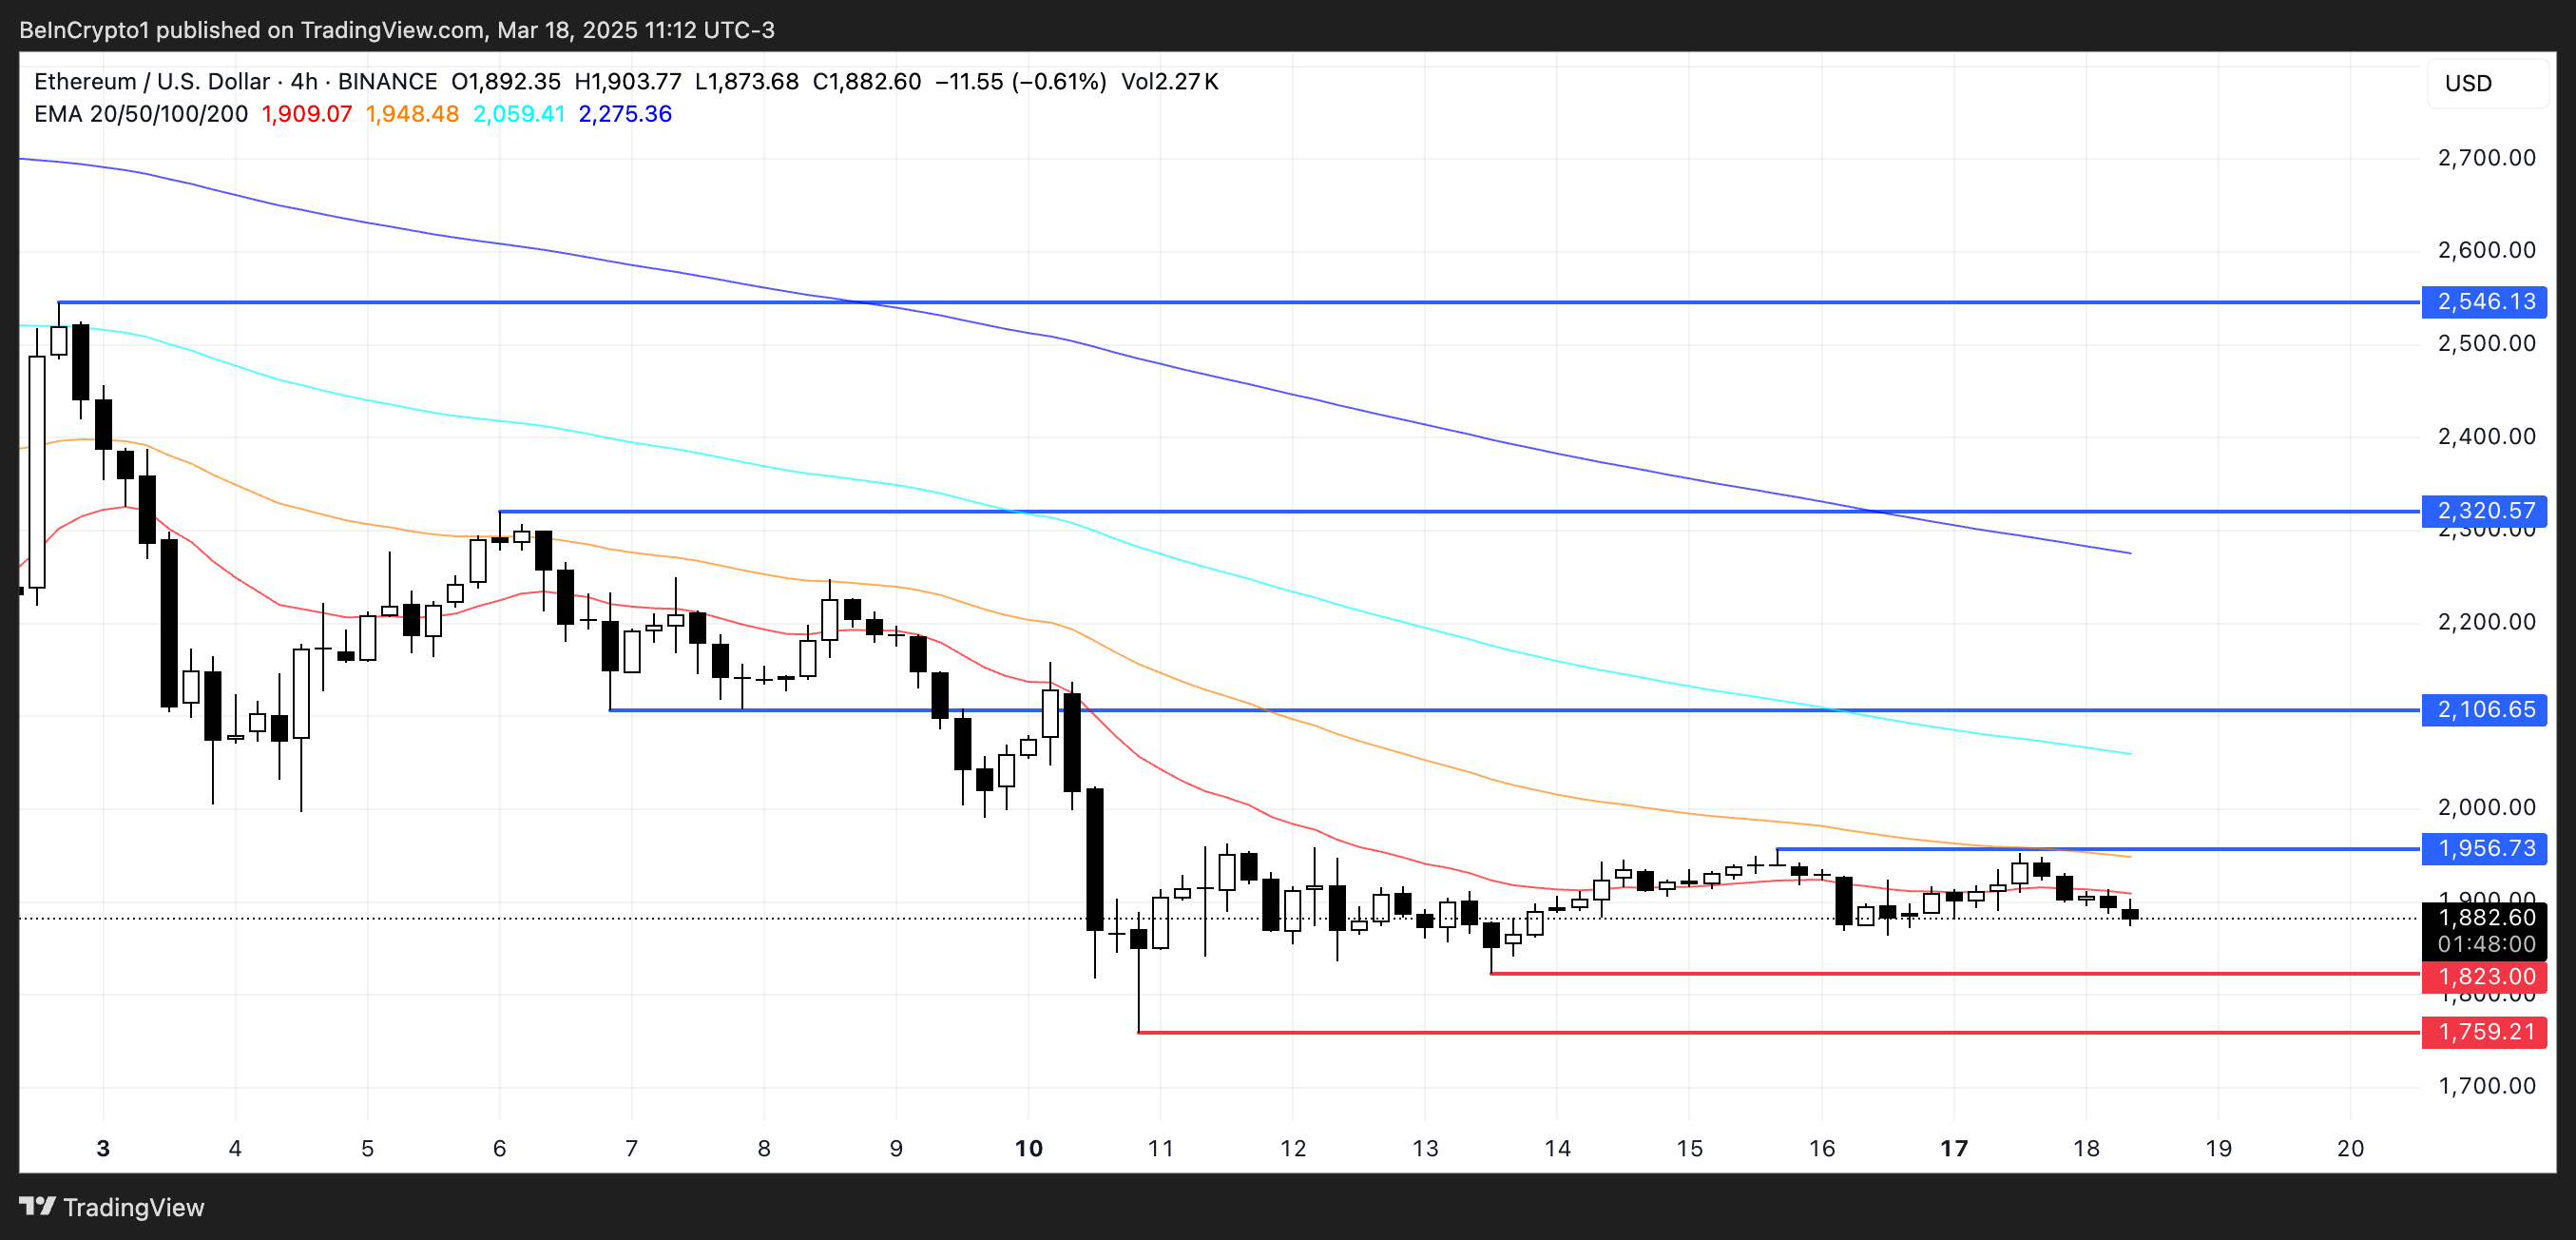
ETH Price Analysis.ETH Price Analysis. Source: TradingView.

However, if Ethereum’s price manages to stabilize and build an uptrend, it could challenge the immediate resistance at $1,956.


A breakout above this level may open the path for a rally toward $2,106, with further bullish momentum potentially pushing ETH to retest $2,320 and even $2,546.


A break above $2,500 would mark the first time Ethereum reclaims that level since March 2, signaling a notable shift in market confidence and buyer strength.

Read more

  • Fed October Rate Decision Preview: Rate Hike Pause Has Become Consensus, How Will US Stocks, Dollar, and Gold React?
  • * The content presented above, whether from a third party or not, is considered as general advice only.  This article should not be construed as containing investment advice, investment recommendations, an offer of or solicitation for any transactions in financial instruments.

    goTop
    quote
    Related Articles
    placeholder
    Bitcoin is back above $80,000 — but 75% of the bounce was shorts, not buyersBitcoin trades at $80,669, back above the $80,000 line after touching $79,145 on October 24. But 75.4% of the last 24 hours of futures liquidations were shorts, CME open interest fell 36,545 BTC in October, and spot ETFs lost $773.5 million on October 22-23. Price is up; positioning is down. Here is why the bounce is a squeeze, and the four things that would make it real.
    Author  Suzie
    53 mins ago
    Bitcoin trades at $80,669, back above the $80,000 line after touching $79,145 on October 24. But 75.4% of the last 24 hours of futures liquidations were shorts, CME open interest fell 36,545 BTC in October, and spot ETFs lost $773.5 million on October 22-23. Price is up; positioning is down. Here is why the bounce is a squeeze, and the four things that would make it real.
    placeholder
    Euro weakens below 1.1200 as traders brace for Fed, ECB rate decisionsThe EUR/USD pair extends the decline near 1.1170 during the early Asian trading hours on Tuesday, pressured by risk-off sentiment. Markets might turn cautious later in the day ahead of the US Federal Reserve (Fed) and European Central Bank (ECB) interest rate decisions later this week.
    Author  FXStreet
    Yesterday 01: 27
    The EUR/USD pair extends the decline near 1.1170 during the early Asian trading hours on Tuesday, pressured by risk-off sentiment. Markets might turn cautious later in the day ahead of the US Federal Reserve (Fed) and European Central Bank (ECB) interest rate decisions later this week.
    placeholder
    Bitcoin Price Forecast: Drops Below $80,000 in Fifth Straight Loss, May Test $75,000 as FOMC Meeting Approaches Bitcoin falls below the $80,000 mark as the October FOMC decision approaches, threatening a further dip toward $75,000.On October 26, Bitcoin (BTC) again lost the key psychological mark o
    Author  TradingKey
    Oct 26, Mon
    Bitcoin falls below the $80,000 mark as the October FOMC decision approaches, threatening a further dip toward $75,000.On October 26, Bitcoin (BTC) again lost the key psychological mark o
    placeholder
    Bitcoin's double top at $88,000: why $78,000 is the line that decides the next moveBitcoin trades near $82,500 (+0.47%) after twice failing at the $88,000 area, forming a potential double top with a neckline at $78,000. A break below the neckline would project a measured target near $68,200; a close back above $88,000 would invalidate the pattern. Here are the structure, the levels and what would confirm either side.
    Author  Suzie
    Oct 19, Mon
    Bitcoin trades near $82,500 (+0.47%) after twice failing at the $88,000 area, forming a potential double top with a neckline at $78,000. A break below the neckline would project a measured target near $68,200; a close back above $88,000 would invalidate the pattern. Here are the structure, the levels and what would confirm either side.
    placeholder
    Bitcoin's V-shaped rebound: from $80,953 back above $83,000 — spot buyers step in as the Fed softens, but ETF outflows lingerBitcoin slid to $80,953 on October 13 — then snapped back above $83,000, reclaiming the 81,847–82,305 'golden zone' on spot-led buying as Williams and Waller cooled the Fed's hawkish tone and the dollar pulled back from its 18-month high. But October ETF outflows near $386 million and a fear-and-greed reading of 56 say the repair is unfinished. Here are the levels, the transmission chain and both cases ahead of tonight's US CPI.
    Author  Suzie
    Oct 14, Wed
    Bitcoin slid to $80,953 on October 13 — then snapped back above $83,000, reclaiming the 81,847–82,305 'golden zone' on spot-led buying as Williams and Waller cooled the Fed's hawkish tone and the dollar pulled back from its 18-month high. But October ETF outflows near $386 million and a fear-and-greed reading of 56 say the repair is unfinished. Here are the levels, the transmission chain and both cases ahead of tonight's US CPI.
    Live Quotes
    Name / SymbolChart% Change / Price
    ETHUSD
    ETHUSD
    0.00%0.00

    cryptocurrency Related Articles

    • Top 3 Price Prediction: Bitcoin, Ethereum, Ripple — Bulls take the reins, with $100K BTC, $3,500 ETH and $2.35 XRP in focus
    • Best Strategies When BTC Price Drops: From Hedging to Accumulating
    • How to Day Trade Crypto? Simplest Day Trading Strategy Ever
    • Trading Chart Patterns:Ultimate Guide to Price Action
    • Places that Provide Cheapest Ways to Buy Bitcoin In 2025
    • 10 Best Crypto With Most Potential to Buy and invest in 2025 - Top Picks from Expert Traders

    Click to view more