

Dogecoin and Shiba Inu Price Analysis: Bearish sentiment rises as corrections deepen

- Gold Price Trend Forecast: Why Did Gold Prices Fall After US CPI Cooled? Fed Chair Speech and Iran Situation Become Obstacles
- Gold Price Trend Forecast: June CPI Plus Fed Chair Congressional Testimony, Can Gold Price Hold Above $4,000?
- Gold slides back closer to $4,050 as Iran risks and Fed hike bets boost USD
- Gold recovers above $4,100 as traders assess US-Iran conflict
- WTI rally takes a timeout amid signs of US-Iran war de-escalation
- US June CPI Preview: Can Cooling Inflation Open Up Fed Rate Cut Expectations? How Will US Stocks, the Dollar, and Gold React?

Dogecoin price faces rejection from the $0.21 daily resistance, signaling a potential correction ahead.
Shiba Inu extends its decline, trading below $0.0000119, hinting at a downturn on the horizon.
Derivatives data show rising short bets on both DOGE and SHIB, indicating growing bearish sentiment among traders.
Dogecoin (DOGE) and Shiba Inu (SHIB) prices are extending their correction after failing to close above their key resistance zones. The bearish thesis for both dog-based memecoin is further supported by the rising short bets among traders, suggesting further correction ahead.
Dog-based memecoins' short bets are rising among traders
CoinGlass long-to-short ratio for DOGE and SHIB reads 0.86 and 0.82, respectively, on Wednesday, the lowest level over a month. The ratio below one suggests bearish sentiment in the market, and traders are betting that the asset price will fall.
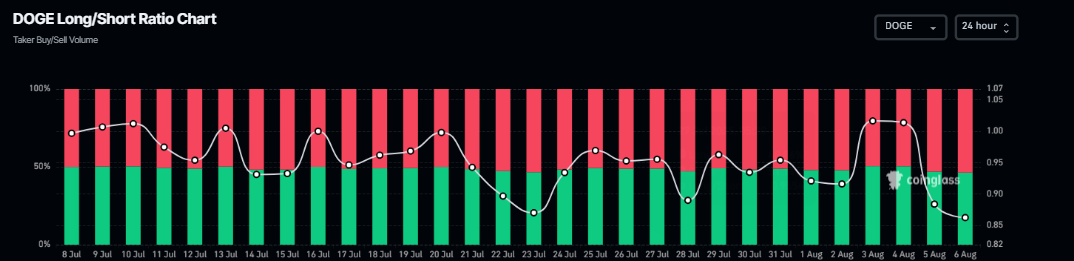
DOGE long-to-short ratio chart. Source: CoinGlass
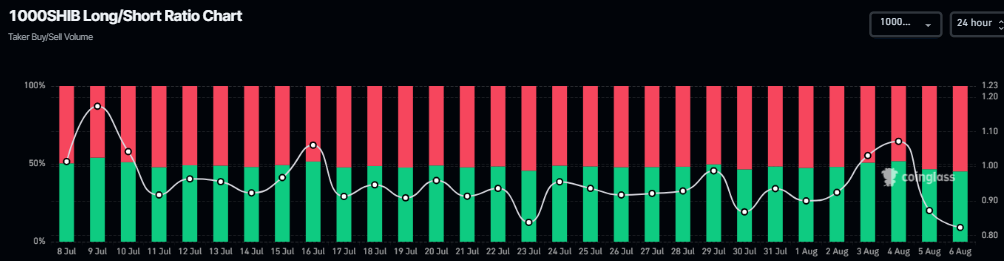
SHIB long-to-short ratio chart. Source: CoinGlass
Another derivatives metric that adds more credence to the bearish thesis is the falling funding rate. The funding rate data for both dog-based memecoin is falling, currently reading 0.0005% for DOGE and 0.0001% for SHIB on Wednesday, and is about to slip into negative territory. If the funding rate flips negative, it suggests shorts are paying longs and indicates a bearish outlook, leading to a sharp fall in the memecoins' price.
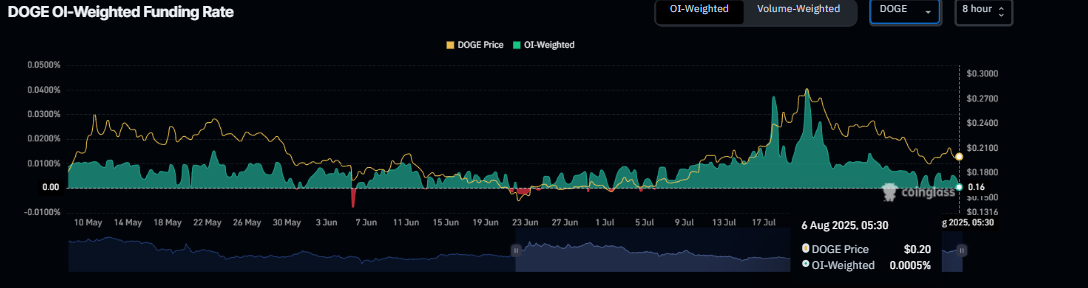
DOGE funding rate chart. Source: CoinGlass
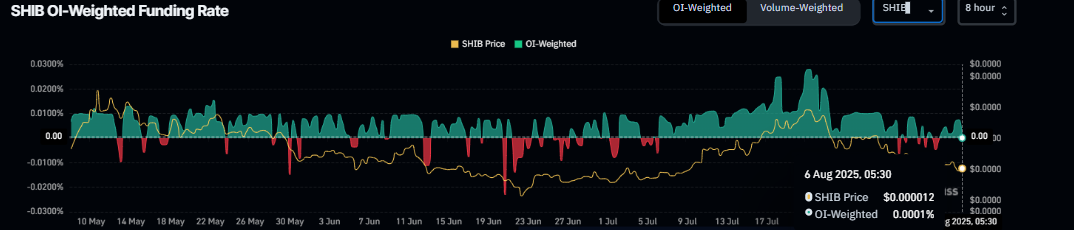
SHIB funding rate chart. Source: CoinGlass
Dogecoin Price Forecast: DOGE faces rejection from its previously broken trendline
Dogecoin price broke below the ascending trendline (drawn by connecting multiple lows since June 22) on Friday, closing below its 50-day Exponential Moving Average at $0.20. However, DOGE recovered slightly from Sunday to Monday but failed to close above the previously broken trendline and continued its correction on Tuesday. At the time of writing on Wednesday, it extends its decline trading below $0.19.
If DOGE continues its correction, it could extend the decline towards its weekly support at $0.18. A successful close below this level could extend the decline to retest its July 1 low of $0.15.
The Relative Strength Index (RSI) on the daily chart reads 42 below its neutral level of 50 and points downward, indicating strong bearish momentum. The Moving Average Convergence Divergence (MACD) continues to hold its bearish crossover and suggests the continuation of the downward trend.
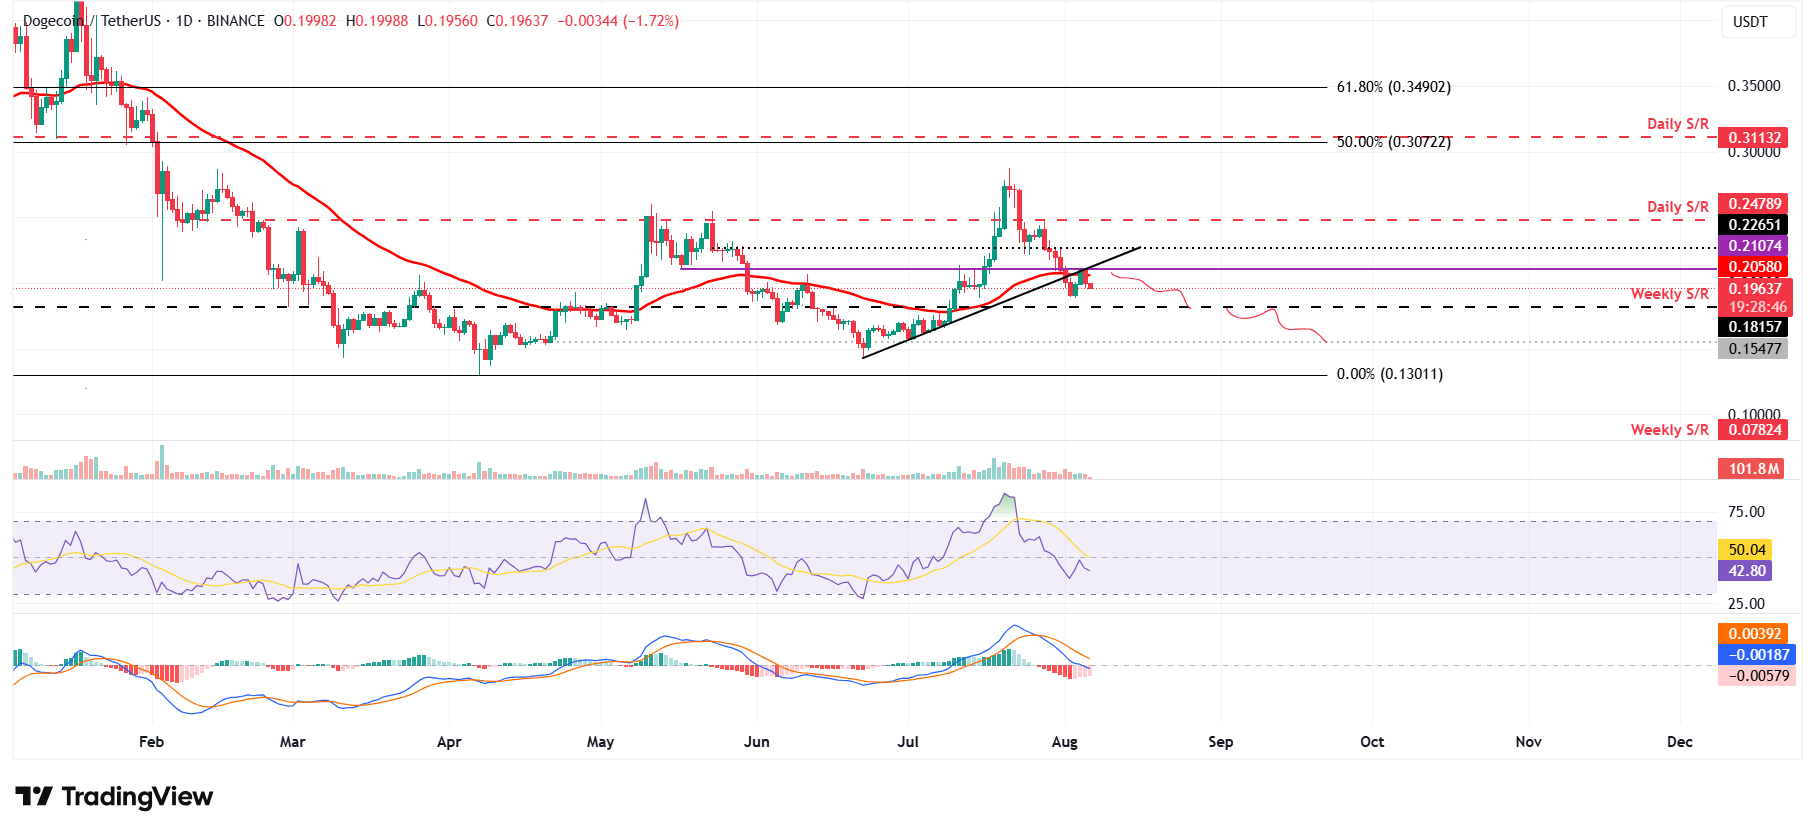
DOGE/USDT daily chart
However, if DOGE recovers, it could extend the recovery toward its next daily resistance at $0.24.
Shiba Inu Price Forecast: SHIB bears are in control of bearish momentum
Shiba Inu price closed below its 50-day EMA on July 29 and declined 10% in the next four days. However, SHIB recovered slightly from Sunday to Monday but failed to maintain its recovery and continued its decline on Tuesday. At the time of writing on Wednesday, it continues its correction, trading around $0.0000119.
If SHIB continues its downward trend, it could extend the decline toward its next daily support at $0.0000111. A successful close below this support could extend an additional decline toward its June 22 low of $0.0000100.
Like Dogecoin, SHIB’s RSI and MACD support the bearish thesis and downward trend.
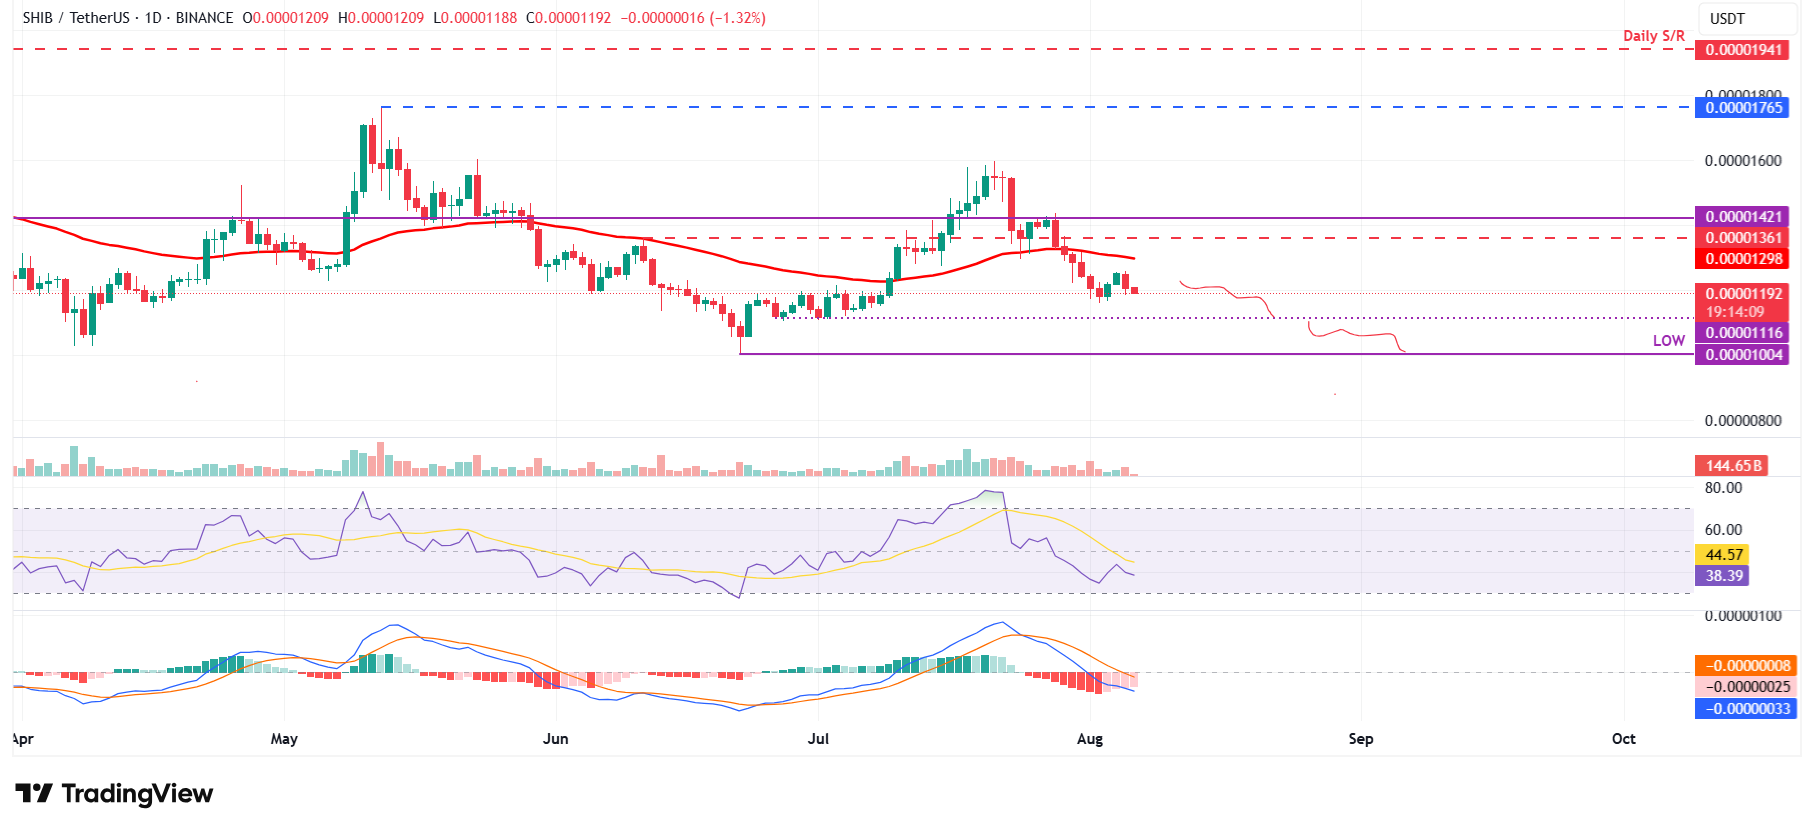
SHIB/USDT daily chart
On the other hand, if SHIB recovers and closes above the 50-day EMA on a daily basis, it could extend the recovery toward its next daily resistance at $0.0000136.
Read more
* The content presented above, whether from a third party or not, is considered as general advice only. This article should not be construed as containing investment advice, investment recommendations, an offer of or solicitation for any transactions in financial instruments.


