Bitcoin Network Activity In Bear Market Zone—Warning Or Opportunity?

Mitrade
Trending Articles
coverImg
Source: DepositPhotos

On-chain data shows the Bitcoin network activity has recently declined into the bear market zone. Here’s what this could mean for the asset.


CryptoQuant’s Bitcoin Network Activity Index Is Flashing A Bear Market Signal


As pointed out by an analyst in a CryptoQuant Quicktake post, the Bitcoin Network Activity Index has recently been inside the bear phase. The “Network Activity Index” here refers to an indicator from CryptoQuant that essentially tracks the amount of activity that the BTC network is witnessing.


The metric uses the data of different activity-related indicators like the transaction count and daily active addresses in order to determine the situation on the blockchain.


Here is the chart shared by the quant that shows the trend in the index and its various moving averages (MAs) over the cryptocurrency’s history:


Bitcoin Network Activity


As displayed in the above graph, the Bitcoin Network Activity Index reached a peak last year, but since December, the metric has been sharply moving down, implying the demand for using the network has been waning. Generally, a surge in user activity is what provides the fuel that any move in the asset’s price needs to be sustainable, so an increase in the Network Activity Index may be considered constructive, while a decrease a bad sign.


Recently, the trend in the network activity has developed in such a manner that the index has entered into what’s considered as a “bear phase.” From the chart, it’s visible that this red signal has maintained even after the latest recovery rally.


The signal has historically come alongside bear markets for Bitcoin (arriving before the price low is in), but there was one notable exception: the second half of the bull run in 2021.


The Network Activity Index signaled a bear phase during this rally, which suggests that, from the perspective of chain usage, this run was always unlikely to last. This may be one of the reasons why the price couldn’t reach a much higher top than the May 2021 one during this bull run.


Nonetheless, Bitcoin was still able to witness a notable period of bullish momentum back then despite the Network Activity Index signal. Thus, while the latest red signal from the metric can indicate the presence of a bear market, it could also just be a signal for a buying opportunity.


In some other news, the combined market cap of the stablecoins has just reached a new all-time high (ATH), as the market intelligence platform IntoTheBlock has shared in an X post.
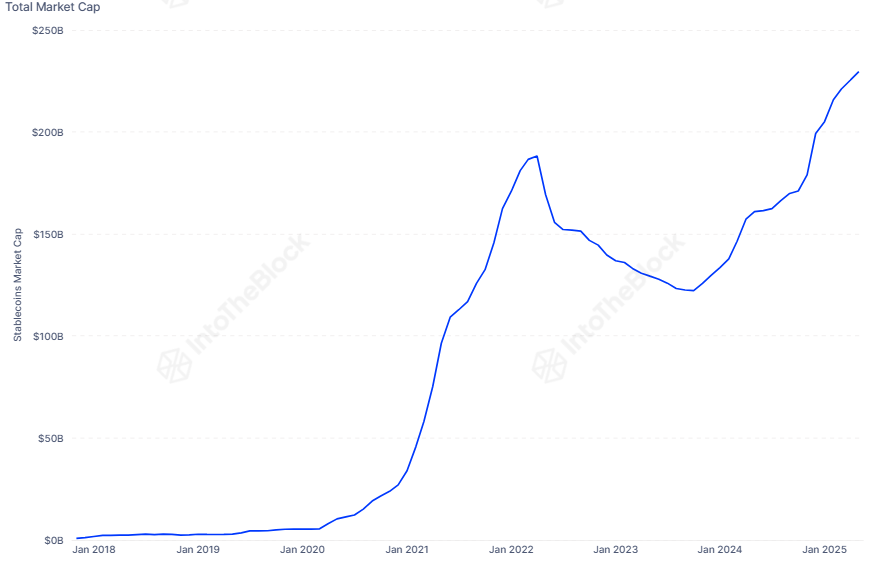

Stablecoin Market Cap


The capital stored in the form of stablecoins may find its way into other cryptocurrencies like Bitcoin, so a rise in their market cap might be looked at as a bullish sign for the sector as a whole.


BTC Price


At the time of writing, Bitcoin is trading around $93,800, down around 1% in the last week.


Bitcoin Price Chart

Read more

  • Forex Today: Yet to be confirmed US-Iran MOU caps US Dollar's upside
  • WTI falls to near $87.00 on potential US-Iran ceasefire extension
  • * The content presented above, whether from a third party or not, is considered as general advice only.  This article should not be construed as containing investment advice, investment recommendations, an offer of or solicitation for any transactions in financial instruments.

    goTop
    quote
    Related Articles
    placeholder
    Bitcoin jumps to three-month high as US–Iran talks unwind oil risk premiumGlobal markets moved sharply on Wednesday as signs of progress in US–Iran negotiations triggered a rapid unwind of war-driven positions, dragging oil prices lower while lifting equities and cryptocurrencies. Bitcoin climbed above $81,000, its highest level in three months, while Brent crude fell roughly 11% to around $98 per barrel. The S&P 500 rose 0.85%...
    Author  Cryptopolitan
    May 07, Thu
    Global markets moved sharply on Wednesday as signs of progress in US–Iran negotiations triggered a rapid unwind of war-driven positions, dragging oil prices lower while lifting equities and cryptocurrencies. Bitcoin climbed above $81,000, its highest level in three months, while Brent crude fell roughly 11% to around $98 per barrel. The S&P 500 rose 0.85%...
    placeholder
    Crypto Overview: Toncoin, Terra Classic rise by double digits as Bitcoin grips $80,000Bitcoin (BTC) rises above $80,000 at press time on Tuesday, triggering a broader market recovery despite the US-Iran ceasefire at risk as tensions resurface. Toncoin (TON) and Terra Classic (LUNC) are leading the market recovery with double-digit gains over the last 24 hours.
    Author  FXStreet
    May 05, Tue
    Bitcoin (BTC) rises above $80,000 at press time on Tuesday, triggering a broader market recovery despite the US-Iran ceasefire at risk as tensions resurface. Toncoin (TON) and Terra Classic (LUNC) are leading the market recovery with double-digit gains over the last 24 hours.
    placeholder
    Bitcoin Rallies 4% to Near $70,000 as Market Optimism ReturnsBitcoin price nears $70,000 as market bullish sentiment rebounds.On Thursday (February 26), Bitcoin (BTC) saw a rare strong rally recently, jumping nearly 4% on the day to a high above $6
    Author  TradingKey
    Feb 26, Thu
    Bitcoin price nears $70,000 as market bullish sentiment rebounds.On Thursday (February 26), Bitcoin (BTC) saw a rare strong rally recently, jumping nearly 4% on the day to a high above $6
    placeholder
    Top 3 Price Prediction: Bitcoin, Ethereum, Ripple – BTC, ETH and XRP post cautious recovery amid downside risksBitcoin (BTC), Ethereum (ETH), and Ripple (XRP) are posting a cautious recovery on Wednesday following a market correction earlier this week.  BTC is approaching a key breakdown level, while ETH and XRP are rebounding from crucial support levels.
    Author  FXStreet
    Feb 25, Wed
    Bitcoin (BTC), Ethereum (ETH), and Ripple (XRP) are posting a cautious recovery on Wednesday following a market correction earlier this week.  BTC is approaching a key breakdown level, while ETH and XRP are rebounding from crucial support levels.
    placeholder
    Top Crypto Losers: BCH, HYPE, PUMP extend losses as Bitcoin drops below $64,000Altcoins, including Bitcoin Cash (BCH), Hyperliquid (HYPE), and Pump.fun (PUMP), are leading losses over the last 24 hours as Bitcoin falls below $64,000 on Tuesday. The technical outlook for BCH, HYPE, and PUMP flags downside risk amid broader market selling.
    Author  FXStreet
    Feb 24, Tue
    Altcoins, including Bitcoin Cash (BCH), Hyperliquid (HYPE), and Pump.fun (PUMP), are leading losses over the last 24 hours as Bitcoin falls below $64,000 on Tuesday. The technical outlook for BCH, HYPE, and PUMP flags downside risk amid broader market selling.
    Live Quotes
    Name / SymbolChart% Change / Price
    BTCUSD
    BTCUSD
    0.00%0.00

    cryptocurrency Related Articles

    • Top 3 Price Prediction: Bitcoin, Ethereum, Ripple — Bulls take the reins, with $100K BTC, $3,500 ETH and $2.35 XRP in focus
    • Best Strategies When BTC Price Drops: From Hedging to Accumulating
    • How to Day Trade Crypto? Simplest Day Trading Strategy Ever
    • Trading Chart Patterns:Ultimate Guide to Price Action
    • Places that Provide Cheapest Ways to Buy Bitcoin In 2025
    • 10 Best Crypto With Most Potential to Buy and invest in 2025 - Top Picks from Expert Traders

    Click to view more