

Bitcoin Price Forecast: BTC recovers above $107,000, yet Israel-Iran conflict clouds bullish outlook

- Gold drops below $4,700 on stronger US Dollar, Middle East tensions
- Bitcoin Returns to $79,000 Level. Prediction Markets Bullish on Breaking $80,000 in April
- Gold holds steady near $4,600 as Fed rate decision looms
- Fed FOMC Meeting Is Approaching: Where Is the Focus? Will There Be More Rate Cuts This Year?
- Goldman Sachs: Structurally Bullish on Gold to $5,400, But Warns of Short-Term Pullback
- Today’s Market Recap: Fed Dissent and AI Capex Surges Define Volatile Earnings Week

Bitcoin increases to around $107,000 on Monday after a slight decline in the previous week.
Investors remain on edge as the Israel-Iran conflict enters its fourth day after fresh strikes over the weekend.
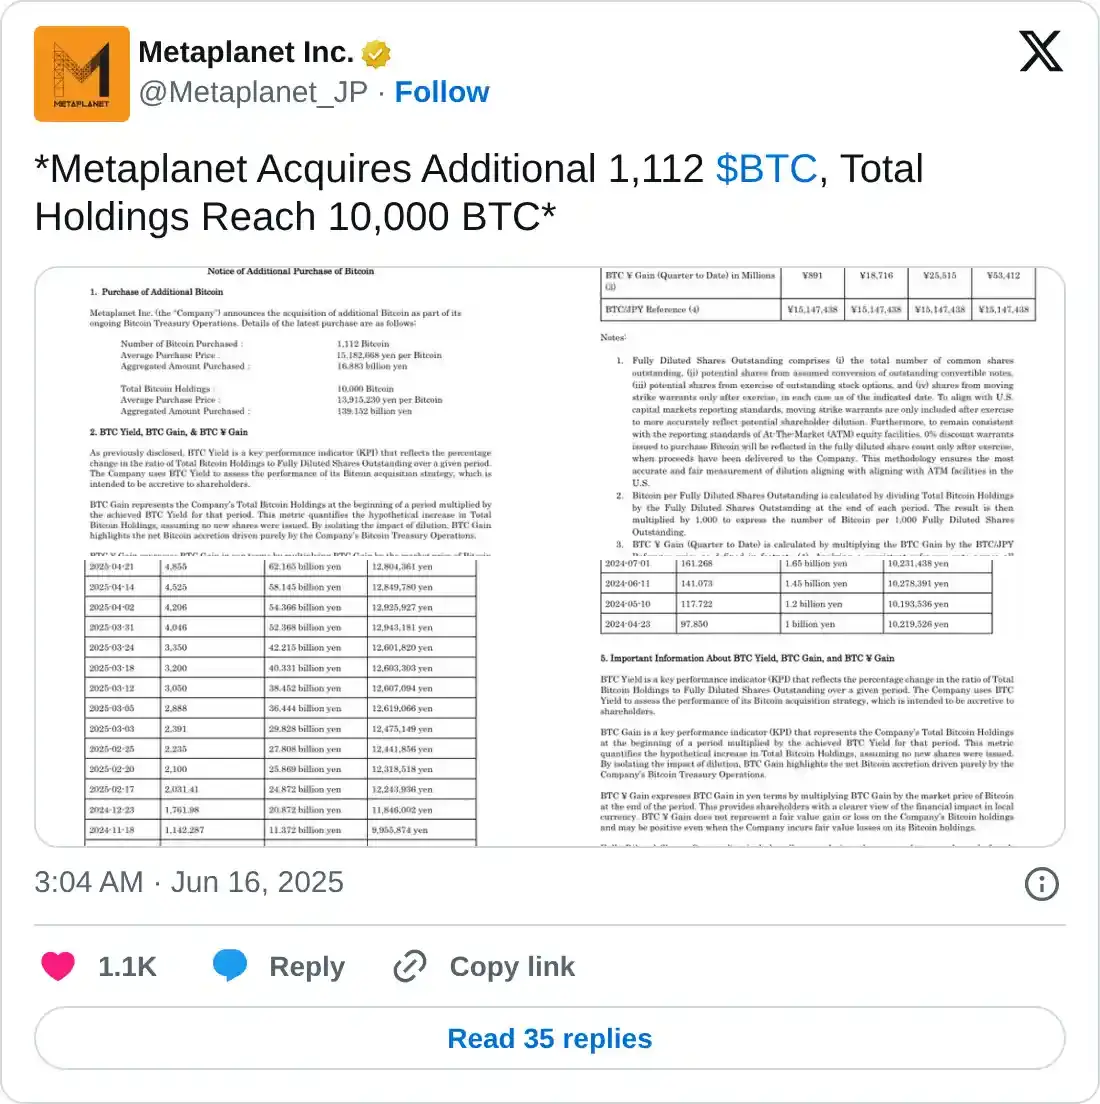
Metaplanet added 1,112 BTC on Monday, while spot Bitcoin ETFs recorded a $1.37 billion inflow over the past week.
Bitcoin (BTC) is showing signs of recovery during the European trading session on Monday, climbing above $107,000 after a slight correction last week. Despite the signs of mild recovery in price action, the market sentiment remains cautious as the Israel-Iran conflict enters its fourth day after fresh strikes over the weekend. Despite the geopolitical headwinds, institutional interest in Bitcoin remains robust, as Metaplanet added 1,100 BTC to its holdings while spot Bitcoin Exchange Traded Funds (ETFs) recorded a total inflow of $1.37 billion last week.
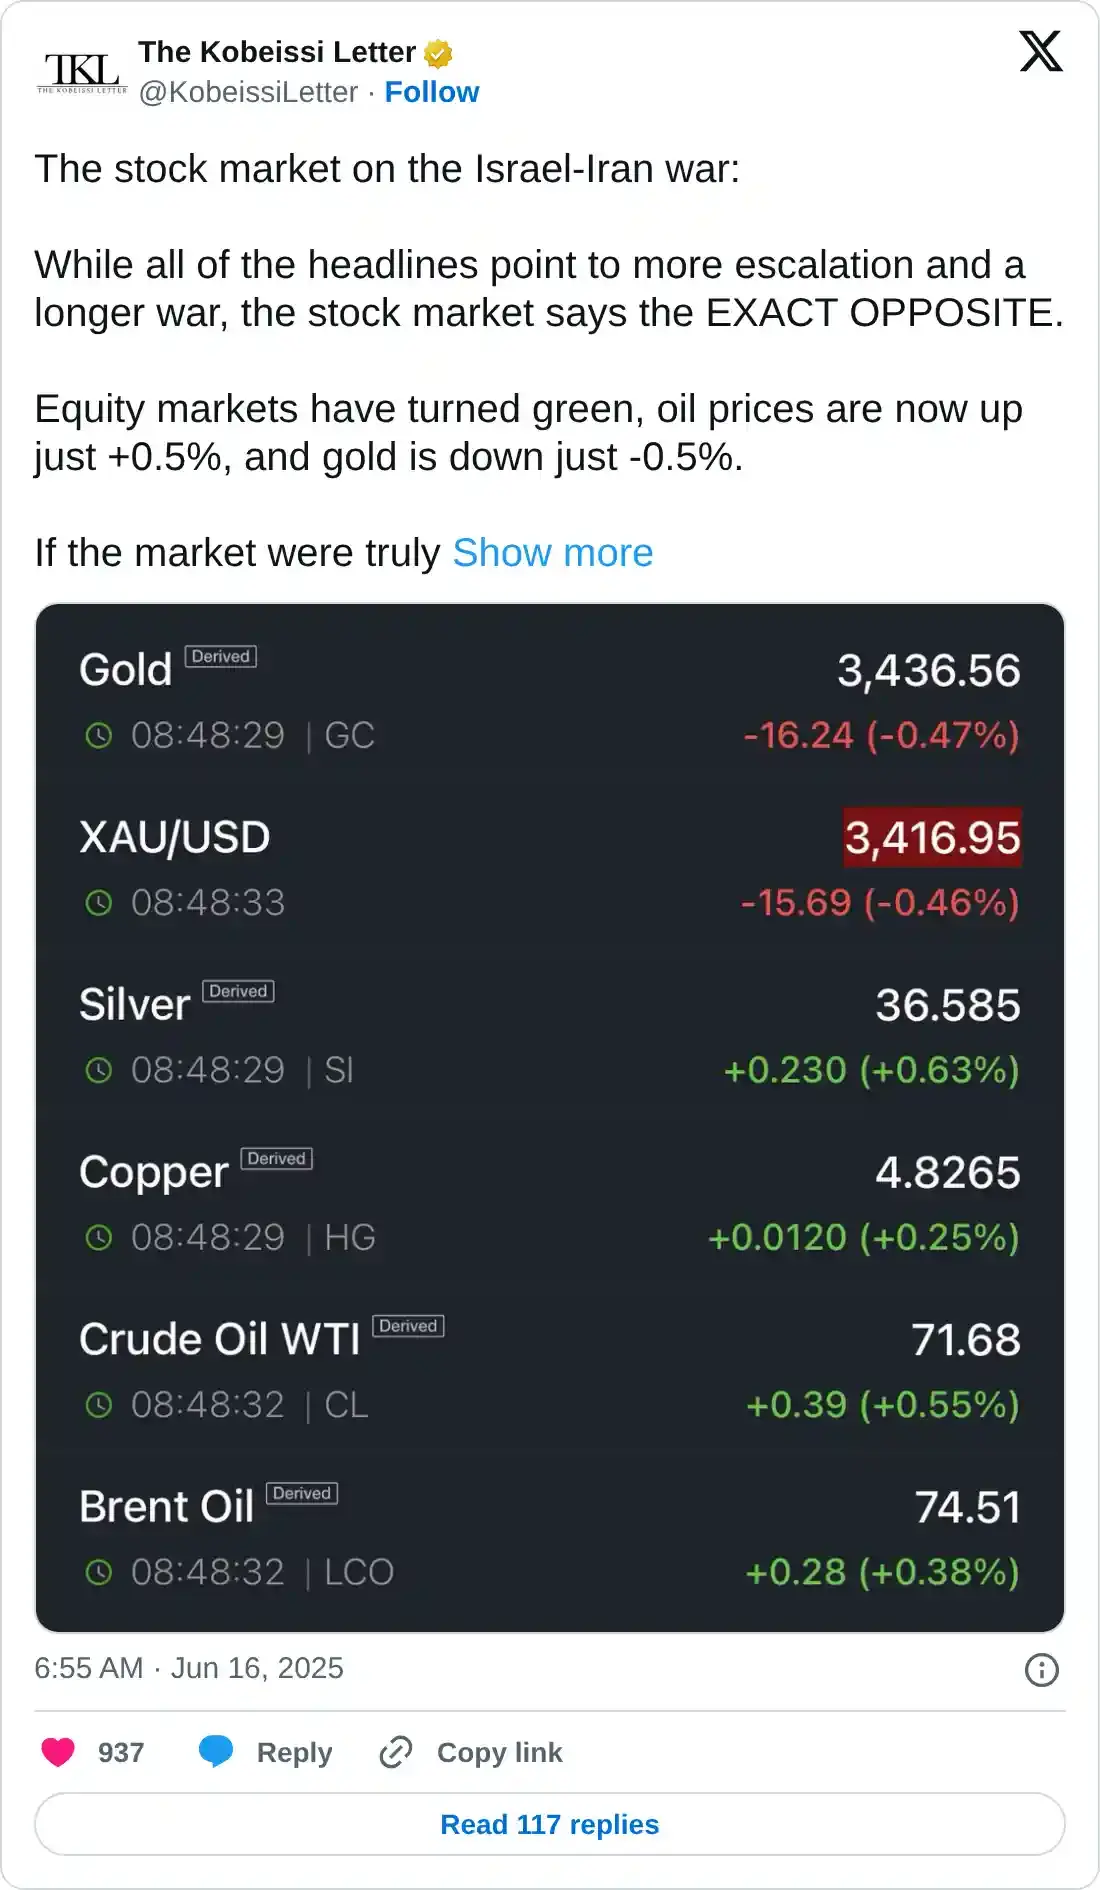
“Market believes a peace deal” – The Kobessi Letter
Bitcoin price faced a sharp correction on Thursday and marked a low at 102,664 on Friday as the Israel-Iran conflict escalated. However, BTC recovered initial losses and closed the day positively around the $106,000 level. Early on Friday morning, Israel launched airstrikes against Iran’s nuclear program and military targets. In response to this attack, Iran launched a new barrage of missiles and drones at Israel on Sunday evening. The strikes between Israel and Iran continue into Monday, escalating the tensions.
The Kobessi Letter reports on Monday that while all of the headlines point to more escalation and a longer war, the stock market says the “EXACT OPPOSITE.”
The report continues that the equities market has turned green, followed by a rise in Oil prices, while safer assets like Gold trades down on Monday. Risky assets like BTC also recoveres slightly on Monday.
The analyst says, “If the market were truly concerned about a long-term conflict, oil prices would have already crossed above $100/barrel,” and concludes that currently, it appears the market believes a peace deal is on the horizon.
The likelihood of a peace deal is slim, and investors should exercise caution, as any further escalation in this ongoing conflict would trigger a risk-off sentiment in the market, which is not conducive to riskier asset prices, such as Bitcoin.
Bitcoin institutional demand remains robust
Bitcoin institutional demand starts the week on a positive note. Japanese investment firm Metaplanet announced on Monday that it has purchased an additional 1,112 BTC, bringing the total holding to 10,000 BTC.
Moreover, the institutional demand for Bitcoin also strengthened last week. According to Coinglass data, US spot Bitcoin ETFs recorded a total inflow of $1.37 billion last week, compared to a $128.81 million outflow in the previous one.
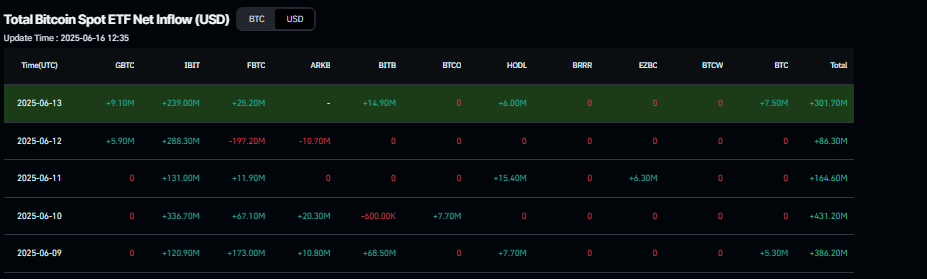
Bitcoin Spot ETF net inflow chart. Source: Coinglass
Bitcoin Price Forecast: BTC price action suggests a bullish trap
Bitcoin price declined sharply, falling from Wednesday’s open of $110,274 to Thursday’s close of $105,671, setting a Fair Value Gap (FVG) of around $108,064. This bearish FVG at $108,064 marks a key resistance zone, meaning that once Bitcoin collects liquidity in this zone, it is likely to continue its correction. At the time of writing on Monday, BTC breaks above its daily resistance level at $106,406 and heads toward the FGV level.
If BTC faces a rejection around the $108,064 level, it could extend the decline to retest its key support at $102,943, the 50-day Exponential Moving Average (EMA). A successful close below this level could extend the decline to retest its key, psychologically important level at $100,000.
The Relative Strength Index (RSI) momentum indicator on the daily chart is hovering around its neutral level of 50, indicating indecision among traders. The Moving Average Convergence Divergence (MACD) indicator on the daily chart displayed a bearish crossover on Thursday, showing a sell signal and indicating a downward trend.
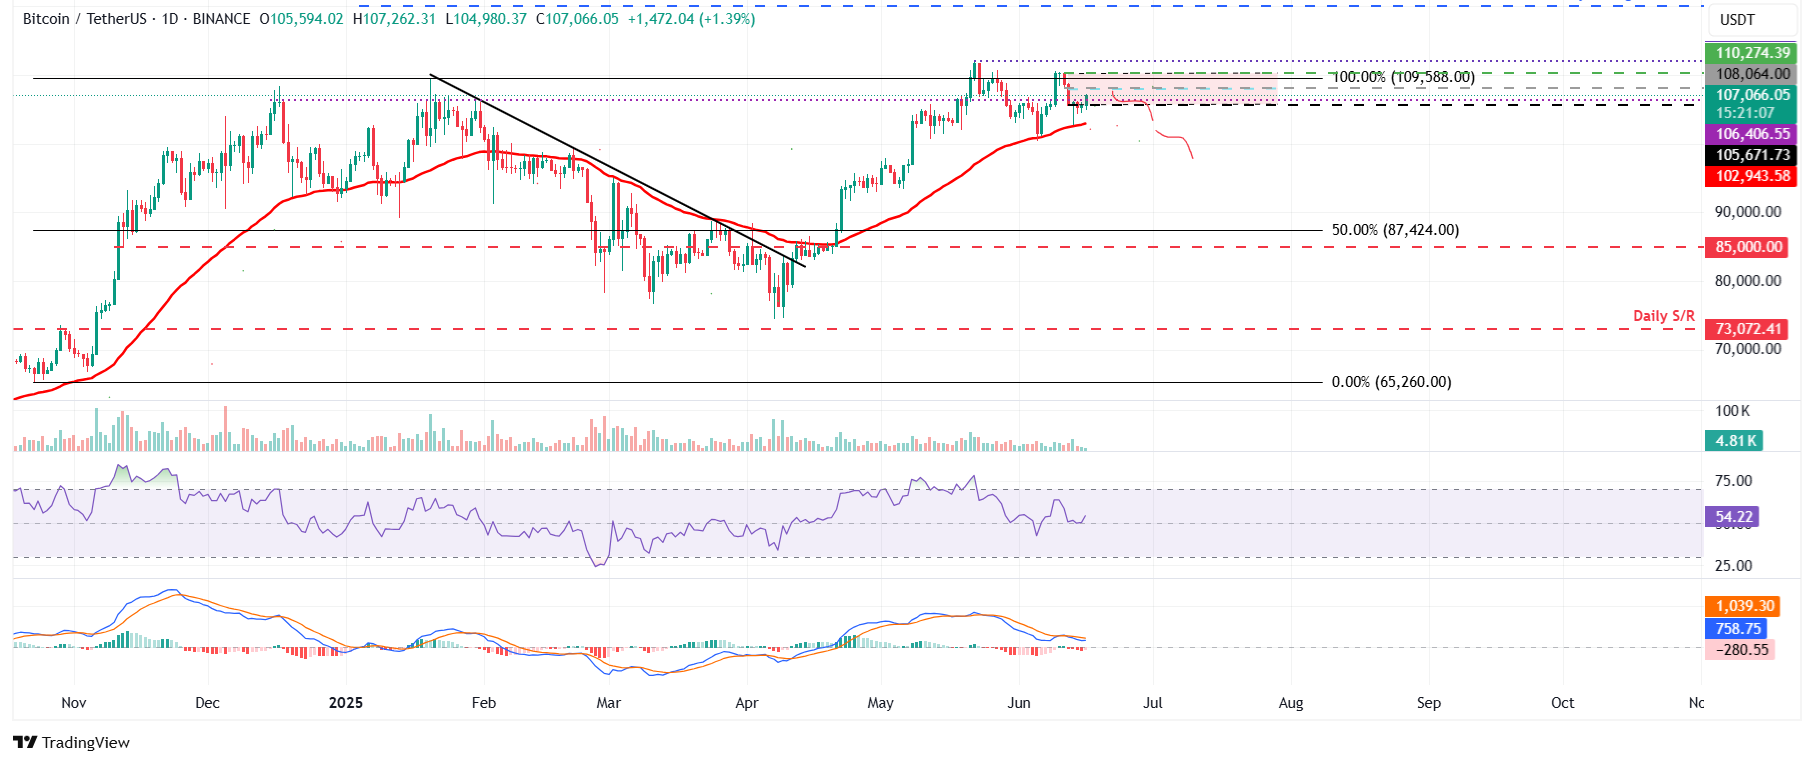
BTC/USDT daily chart
On the contrary, if BTC recovers and closes above its FVG level at $108,064, it could extend the recovery toward retesting its May 22 all-time high of $111,980.

Read more
* The content presented above, whether from a third party or not, is considered as general advice only. This article should not be construed as containing investment advice, investment recommendations, an offer of or solicitation for any transactions in financial instruments.


