




Crypto Today: Bitcoin holds the 50-day EMA as Ethereum and XRP face structural resistance
- Bitcoin rises above $81,000 on Friday after defending the 50-day EMA support.
- Ethereum broadly consolidates around $2,400, sitting on medium and long-term moving average cluster.
- XRP springs up and trades above $1.32 after Thursday’s sharp decline tests the $1.30 demand area.
Bitcoin (BTC) gradually ticks up on Friday, trading above $81,000. The Crypto King has recently defended structural support near $80,000, reinforcing the prevailing bullish outlook. Ethereum (ETH) similarly edges higher above $2,400, while Ripple (XRP) trades above $1.32 after testing support around $1.30.
Focus stays on the Fed decision
The Federal Reserve (Fed) is widely expected to keep interest rates unchanged in the 3.75-4.00% range on Wednesday. Market participants are pricing in about 92% odds that the Federal Open Market Committee (FOMC) will hold rates following a 25-basis-point hike in September.
The FedWatch Tool shows a 8% chance of a rate hike in October. However, the odds are higher for a December raise.
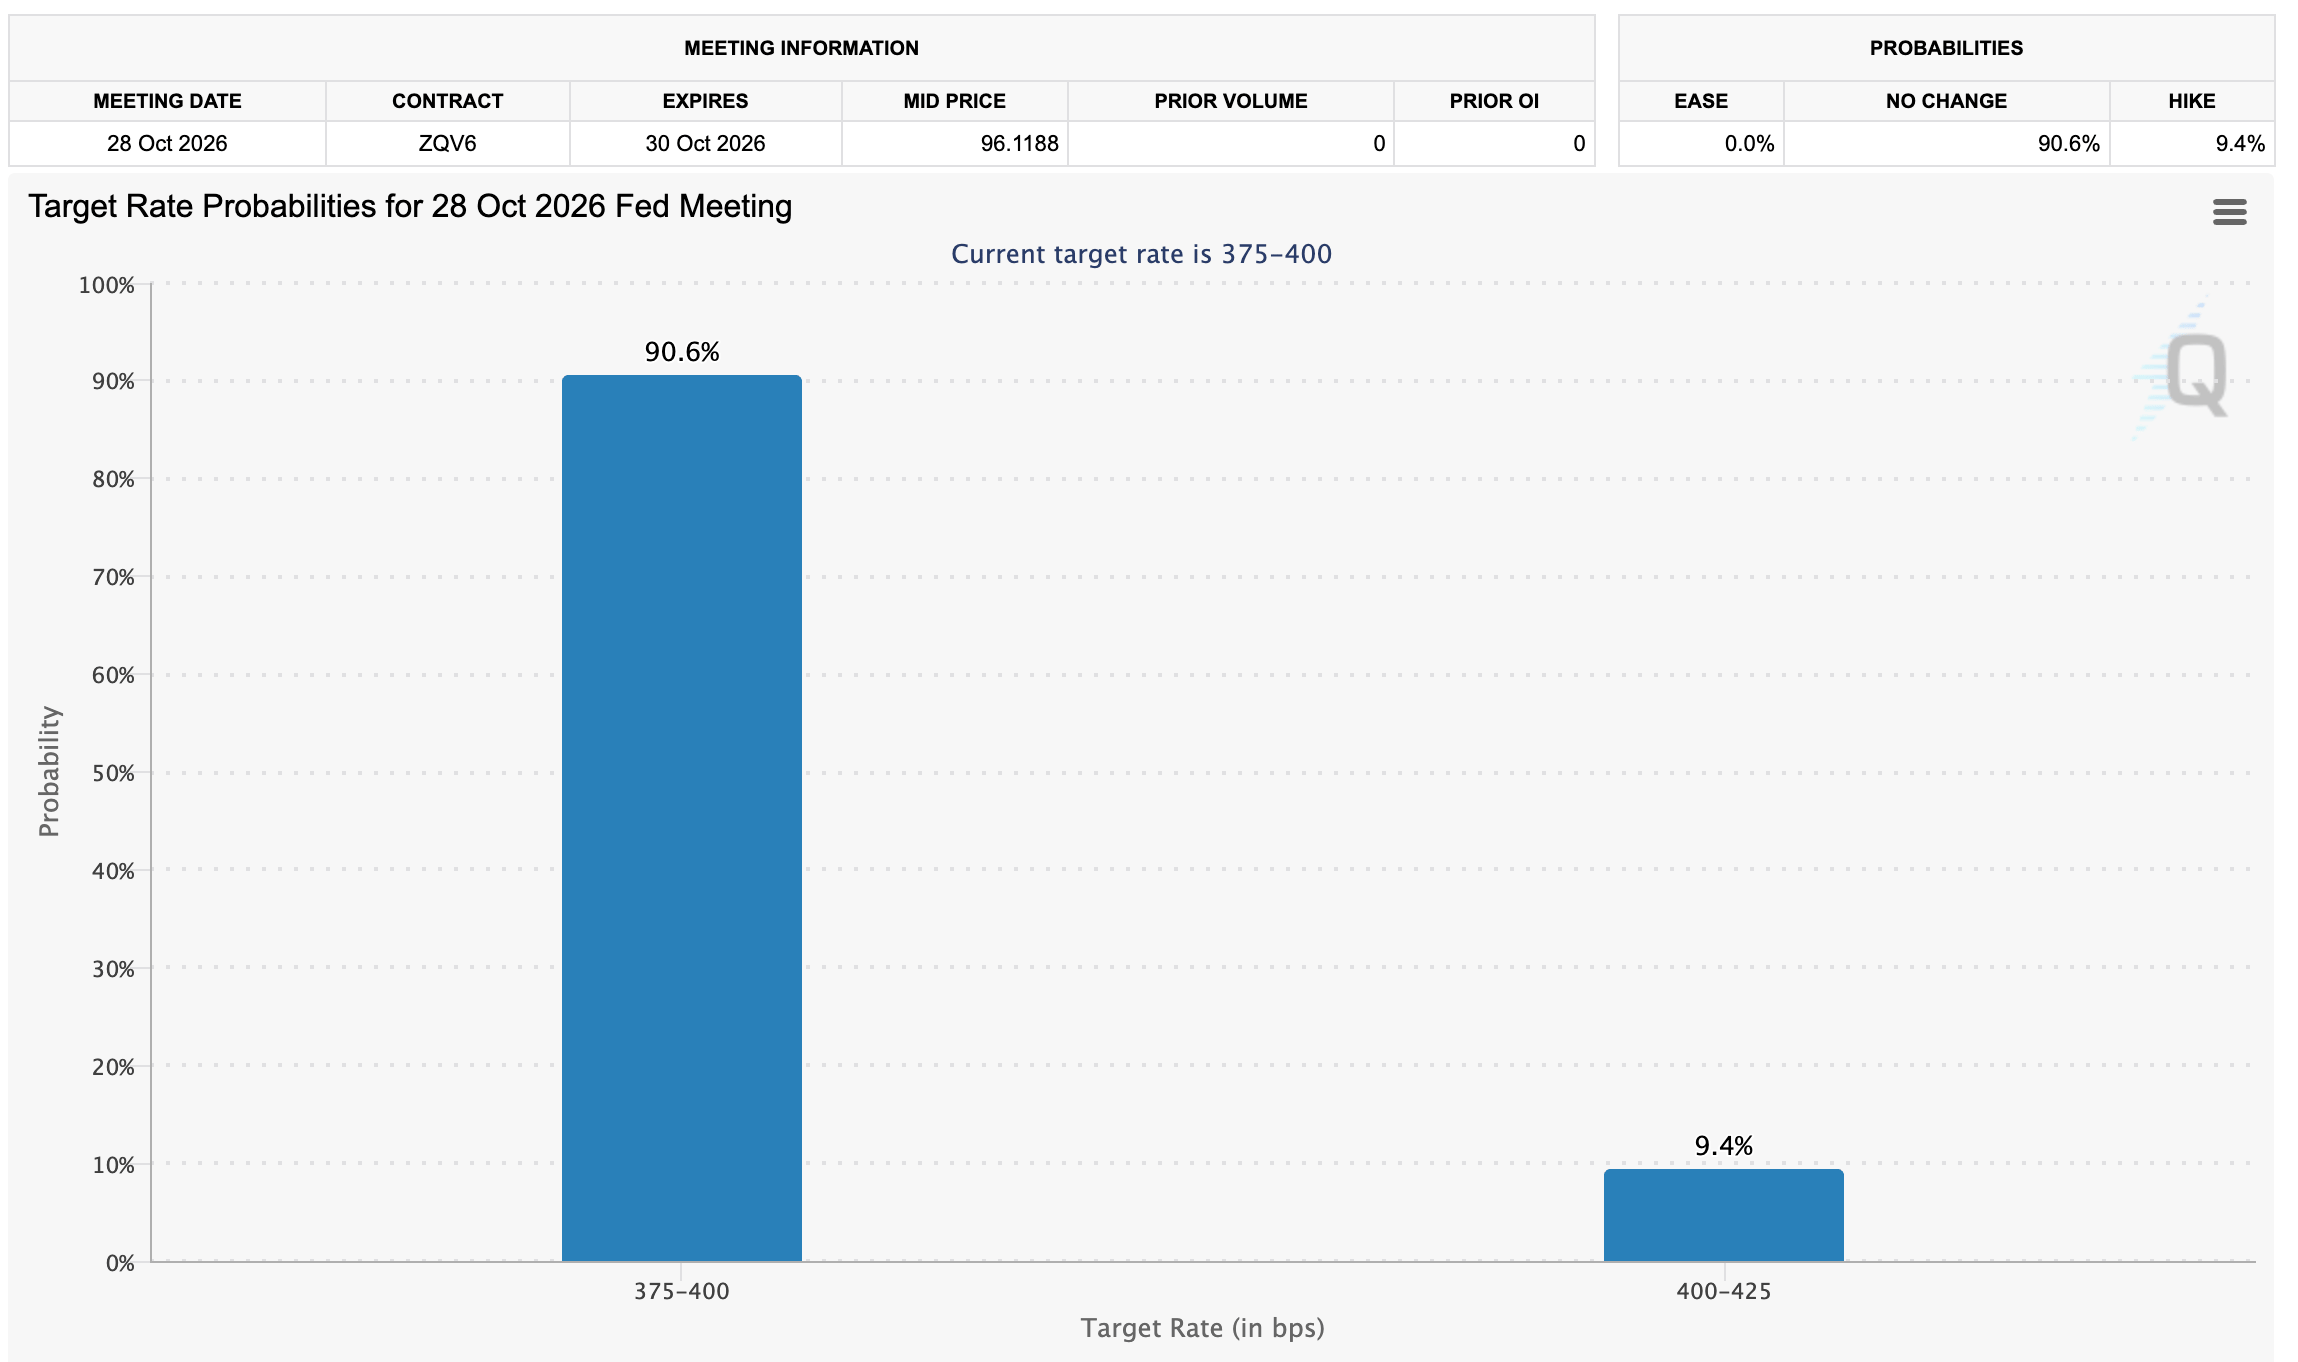
"The FOMC meets 27-28 October, with the decision on Wednesday, 28 October. With inflation risk still elevated and risk assets already tightening financial conditions, the market will watch closely for any shift in the Fed's reaction function," Crypto Finance said in an emailed analysis report.
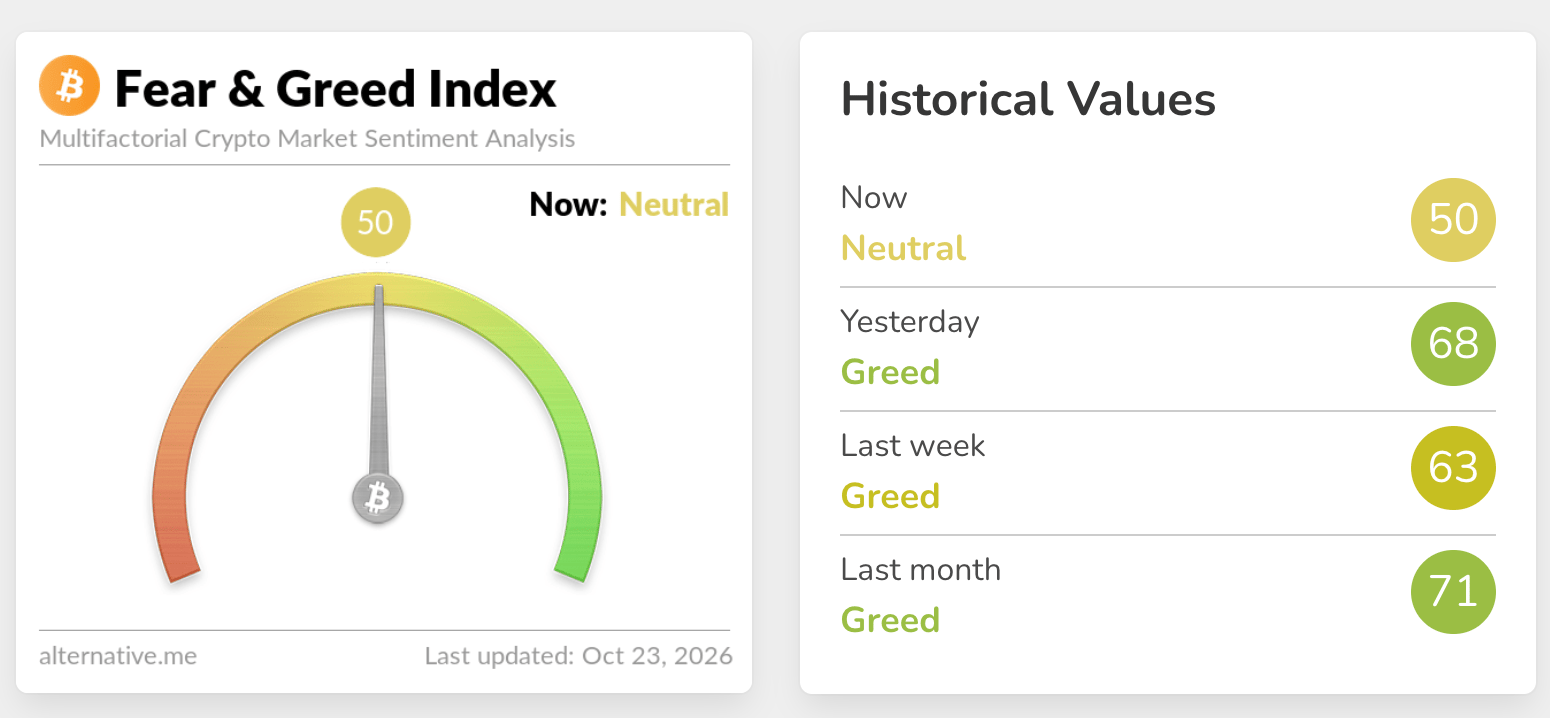
Appetite for digital asset investment products has taken a backseat this week, with the crypto Fear & Greed Index mirroring the decline to 50 in Neutral territory on Friday, down from 68 in the Greed range the day before. This retreat aligns with heightened volatility ahead of the Fed decision, as investors sit on the sidelines until the central bank’s policy direction is established.
Technical analysis: Bitcoin upholds bullish bias
Bitcoin trades at $81,862, holding a bullish near-term bias as price remains above the key Exponential Moving Averages (EMAs). The 50-day EMA around $80,879 and the SuperTrend line near $79,664 both sit below spot, suggesting layered dynamic support, while the 100-day and 200-day EMAs at $77,529 and $76,209 further reinforce a broader uptrend structure.
Momentum, however, looks more cautious, with the Relative Strength Index (RSI) hovering just below the 50 mark and the Moving Average Convergence Divergence (MACD) indicator still negative, hinting that upside continuation may be slower and more corrective than impulsive.
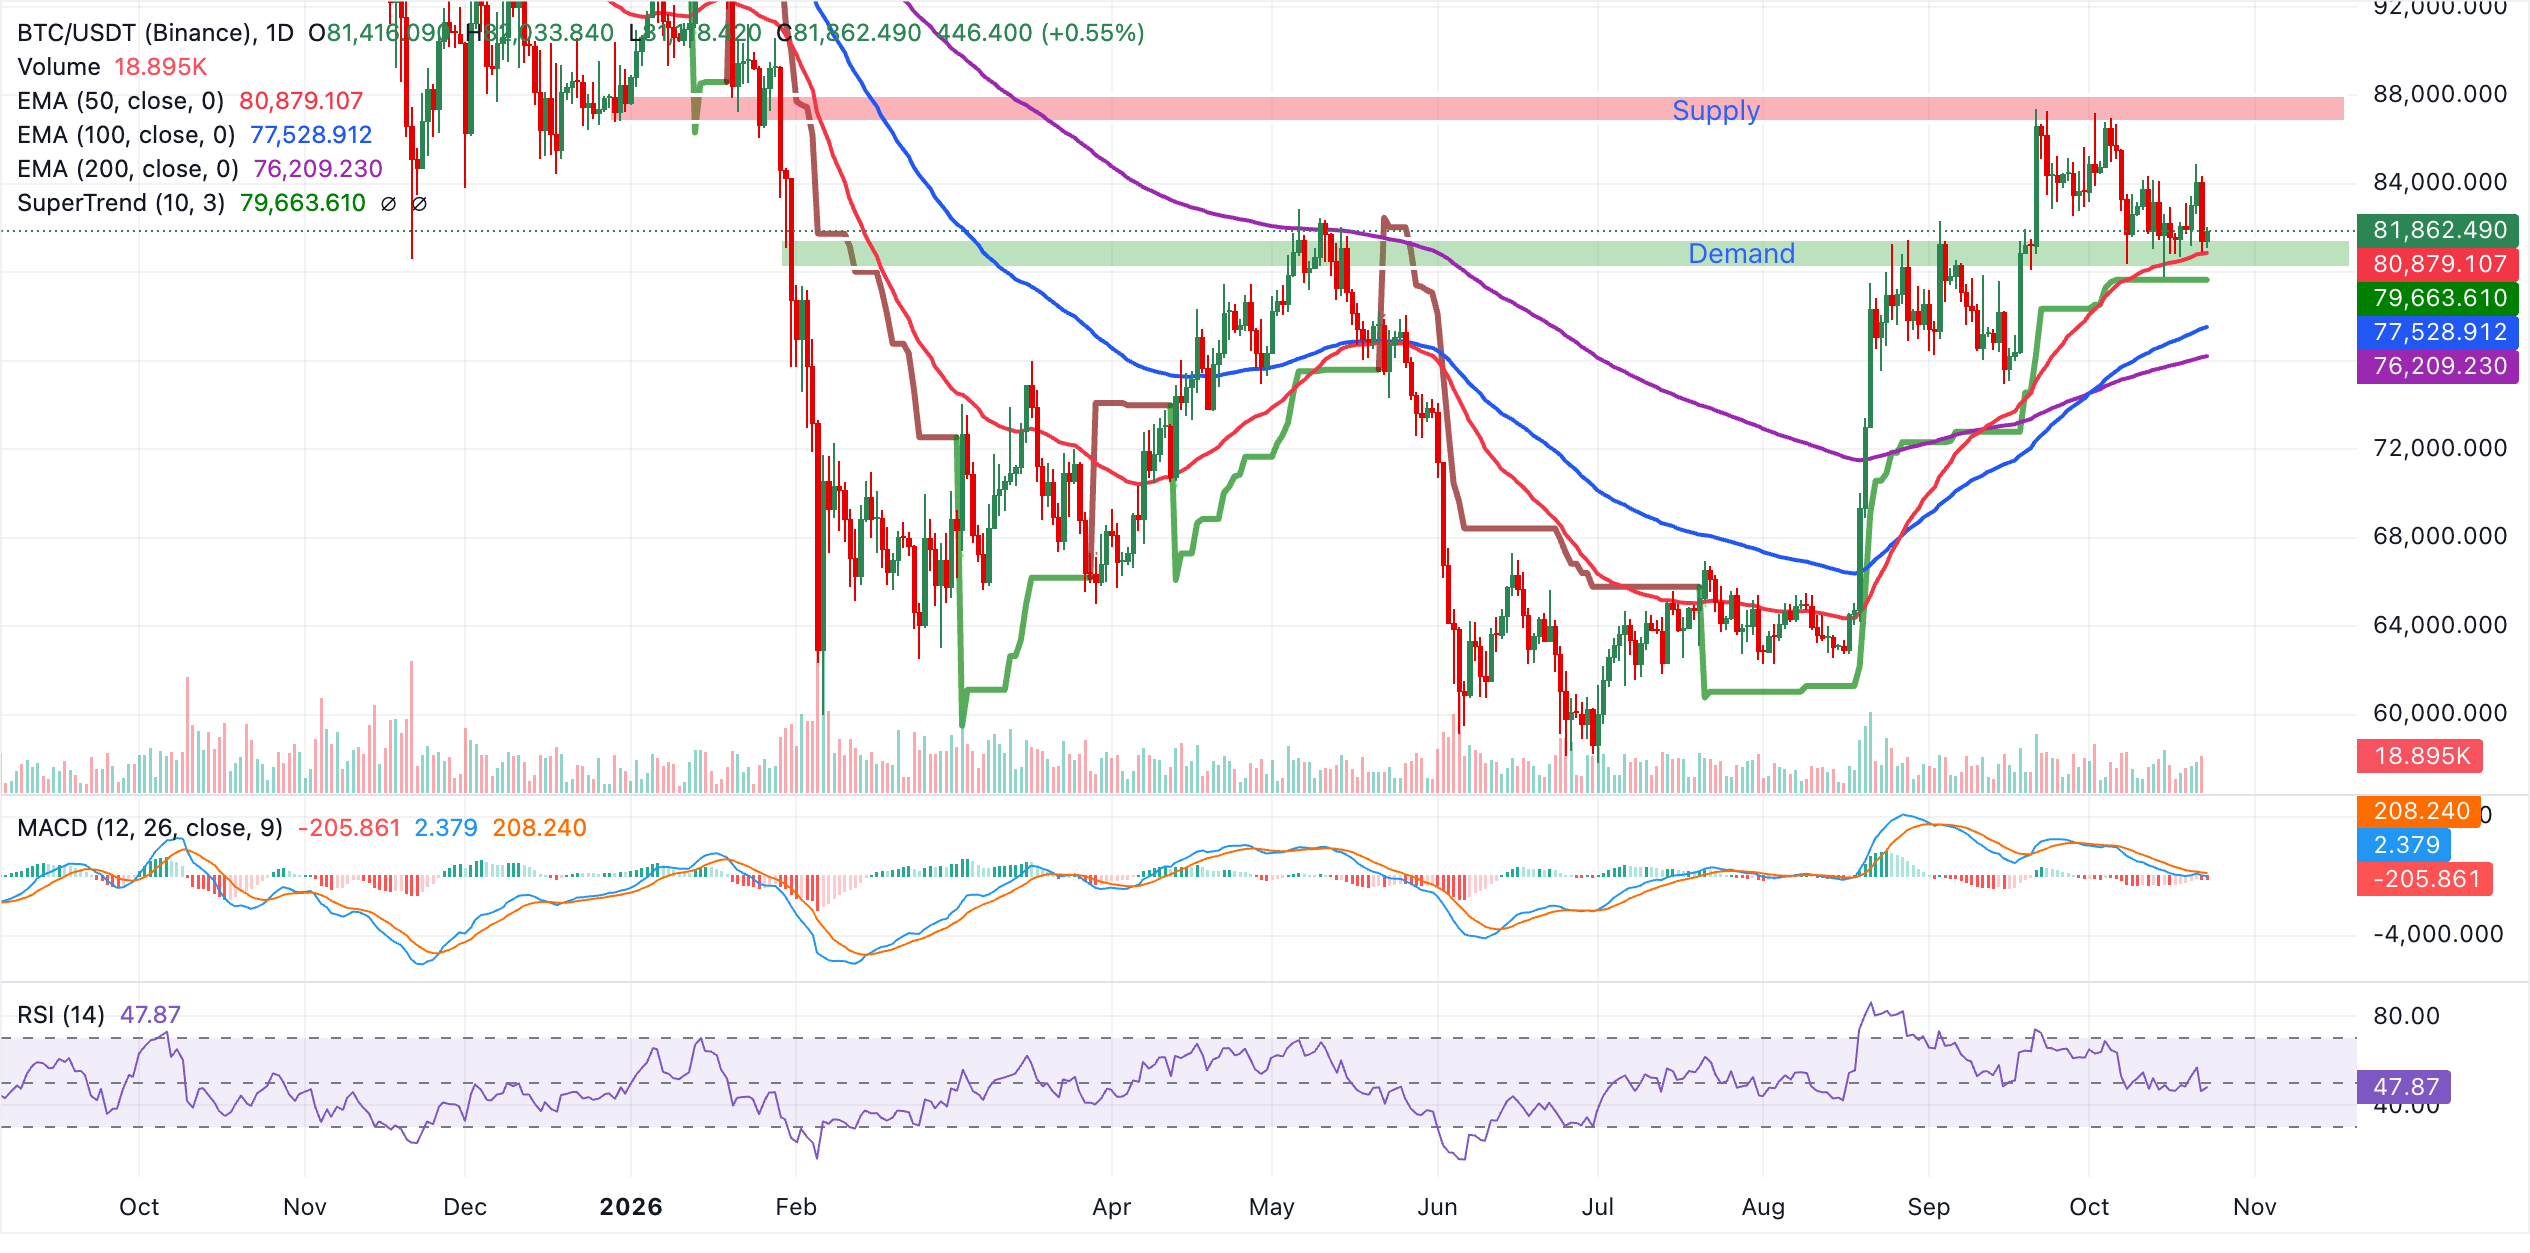
Initial support lies at the 50-day EMA at $80,879, followed by the SuperTrend baseline at $79,664, where buyers could look to defend the current bullish structure. Deeper pullbacks would expose the 100-day EMA at $77,529, then the 200-day EMA at $76,209, as additional support layers.
With no defined indicator resistance on the daily chart, the focus remains on whether price can sustain above these clustered EMAs. A daily close back below the 50-day EMA would weaken the constructive bias, while holding above it keeps the door open for a gradual resumption of the broader uptrend.
"The $80,000-$81,000 area remains the line bulls have repeatedly defended, while $83,000 is the first level that would suggest buyers are beginning to regain control. Beyond that, the $85-$87,000 area remains the larger resistance zone that capped the September and early-October rally," Crypto Finance added.
Altcoins technical analysis: Ethereum and XRP eye short-term recovery
Ethereum trades at $2,410, holding above the 100-day and 200-day EMAs at $2,365 and $2,317, respectively, reinforcing a mildly constructive near-term tone. Price has reclaimed the upward support trend line’s break area near $2,368, while remaining below the 50-period EMA at $2,475 and the SuperTrend resistance at $2,675, suggesting upside attempts are still capped.
The MACD indicator stays below zero but has improved slightly, and the RSI prints around 41, together hinting at stabilizing rather than impulsive bullish momentum.
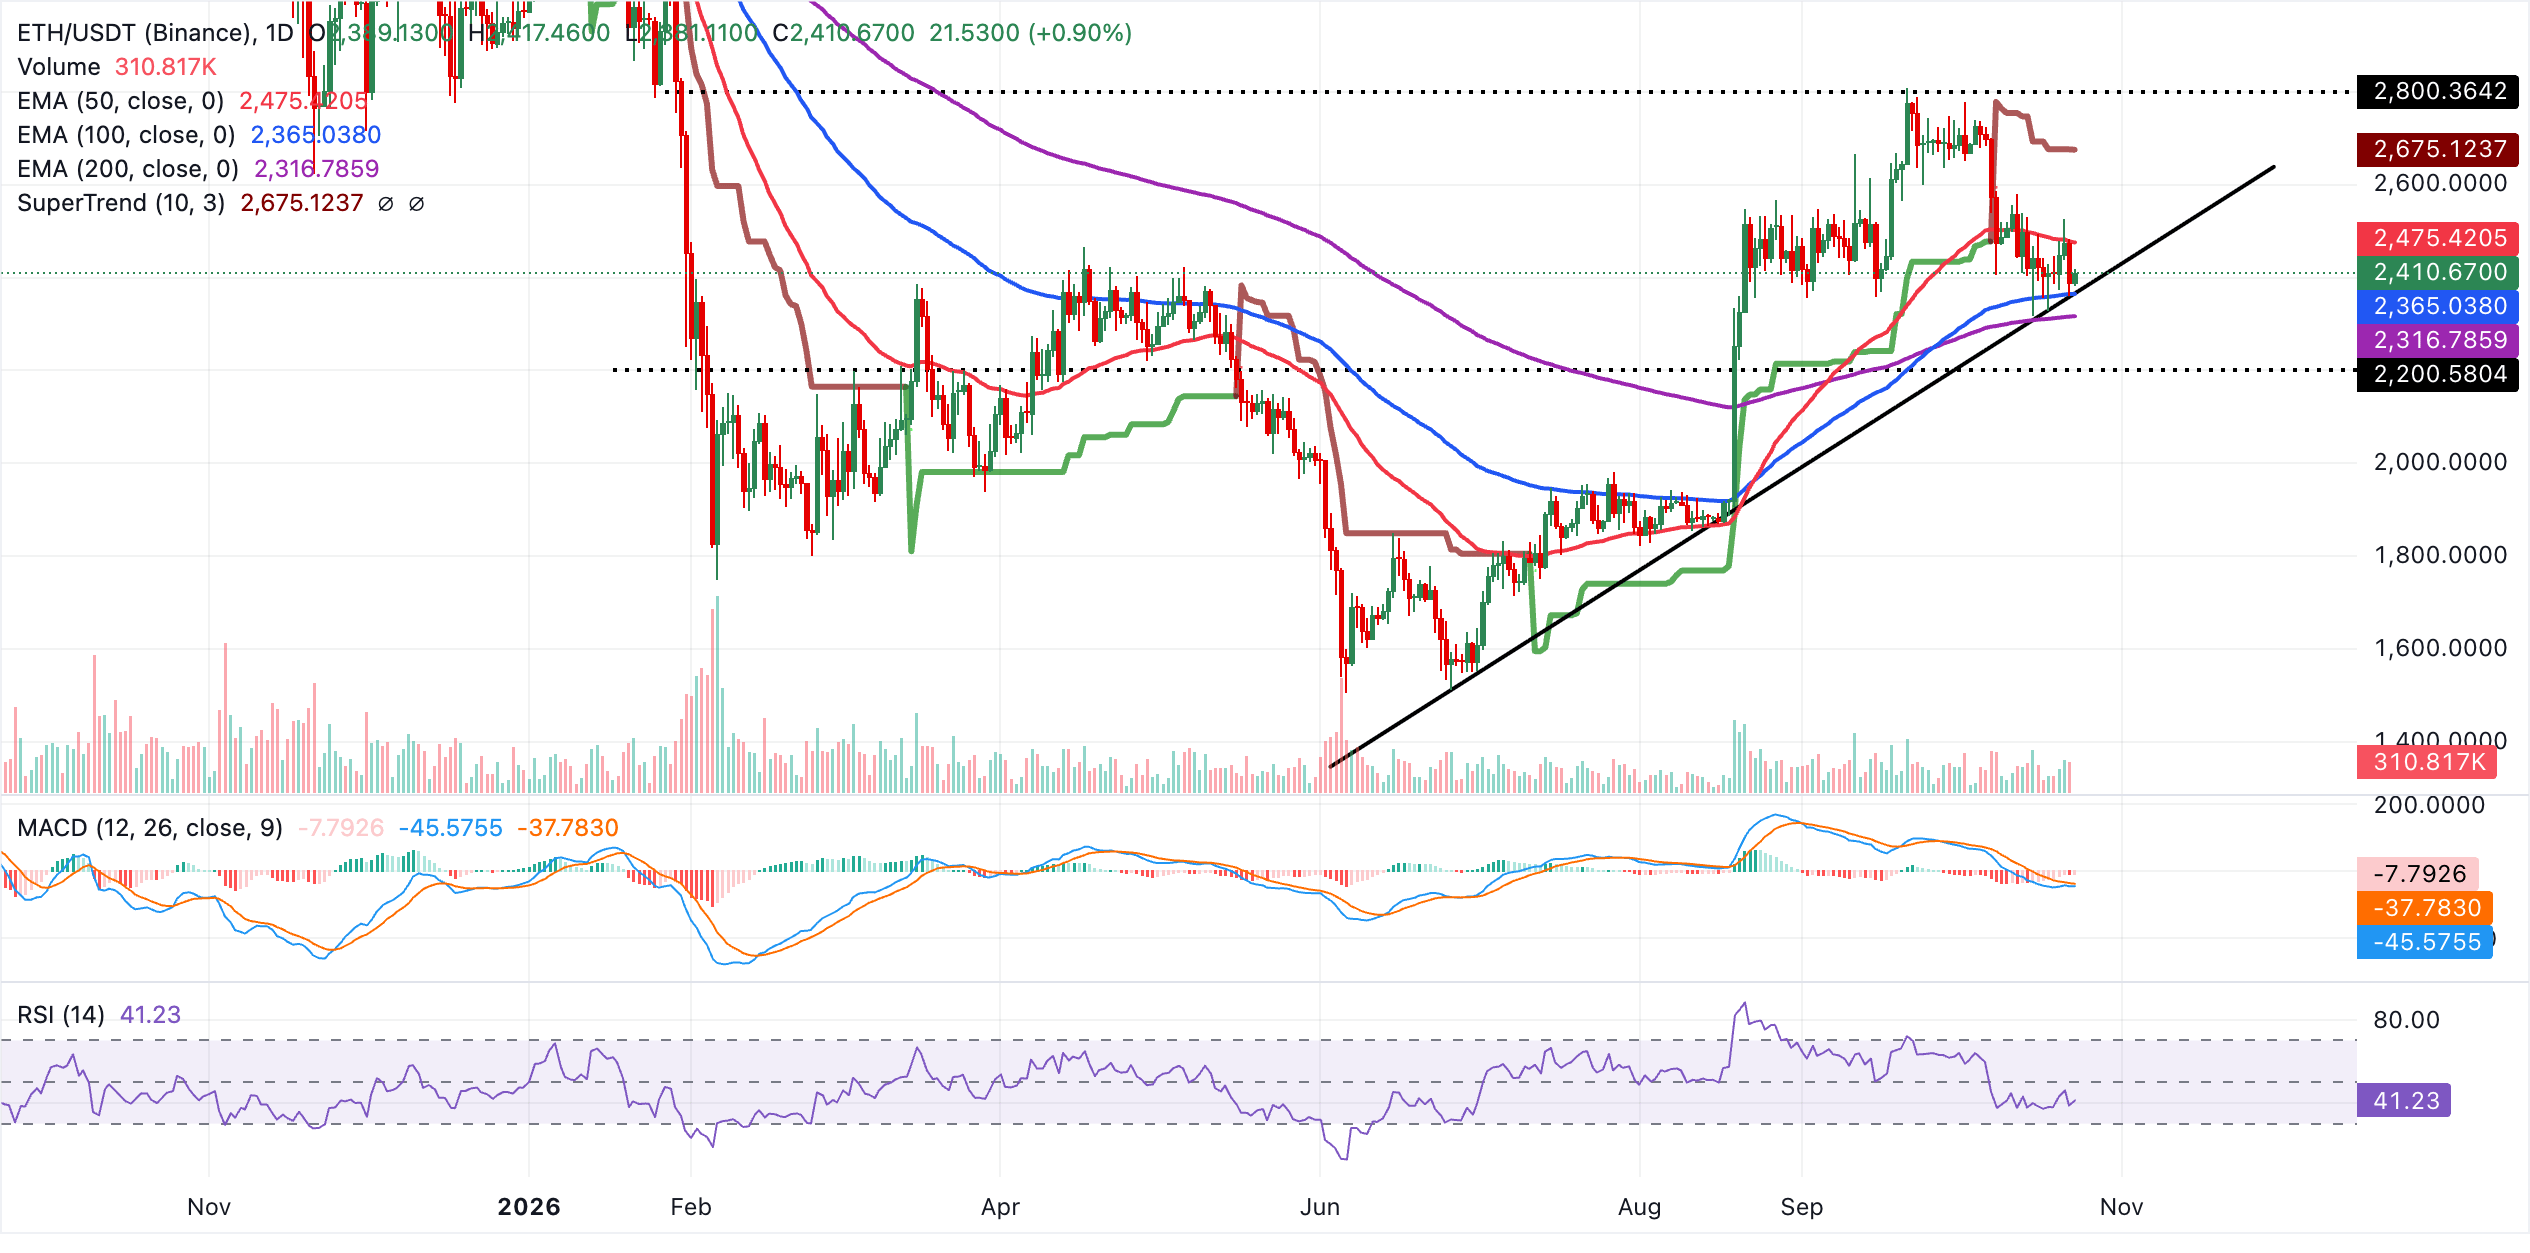
Immediate support is seen at the reclaimed trendline zone around $2,368, followed closely by the 100-EMA at $2,365 and then the 200-EMA near $2,317, where buyers may look to defend the broader uptrend structure.
Initial resistance aligns with the 50-EMA around $2,475, ahead of a stronger barrier at the SuperTrend level near $2,675. A daily close above these hurdles would open the way for a more decisive bullish continuation, while failure to hold above the $2,368-$2,365 cluster would shift the focus back toward the $2,317 area.
XRP, meanwhile, trades at $1.32, but remains under pressure as price sits below the 100-day, 50-day and 200-day EMAs at $1.34, $1.37 and $1.38, respectively, keeping the broader tone bearish despite the recent bounce from lower levels.
The SuperTrend indicator at $1.47 stays well above spot, reinforcing the prevailing downtrend, while the RSI near 43 recovers from oversold territory but still suggests only modest bullish momentum against a dominant bearish structure.
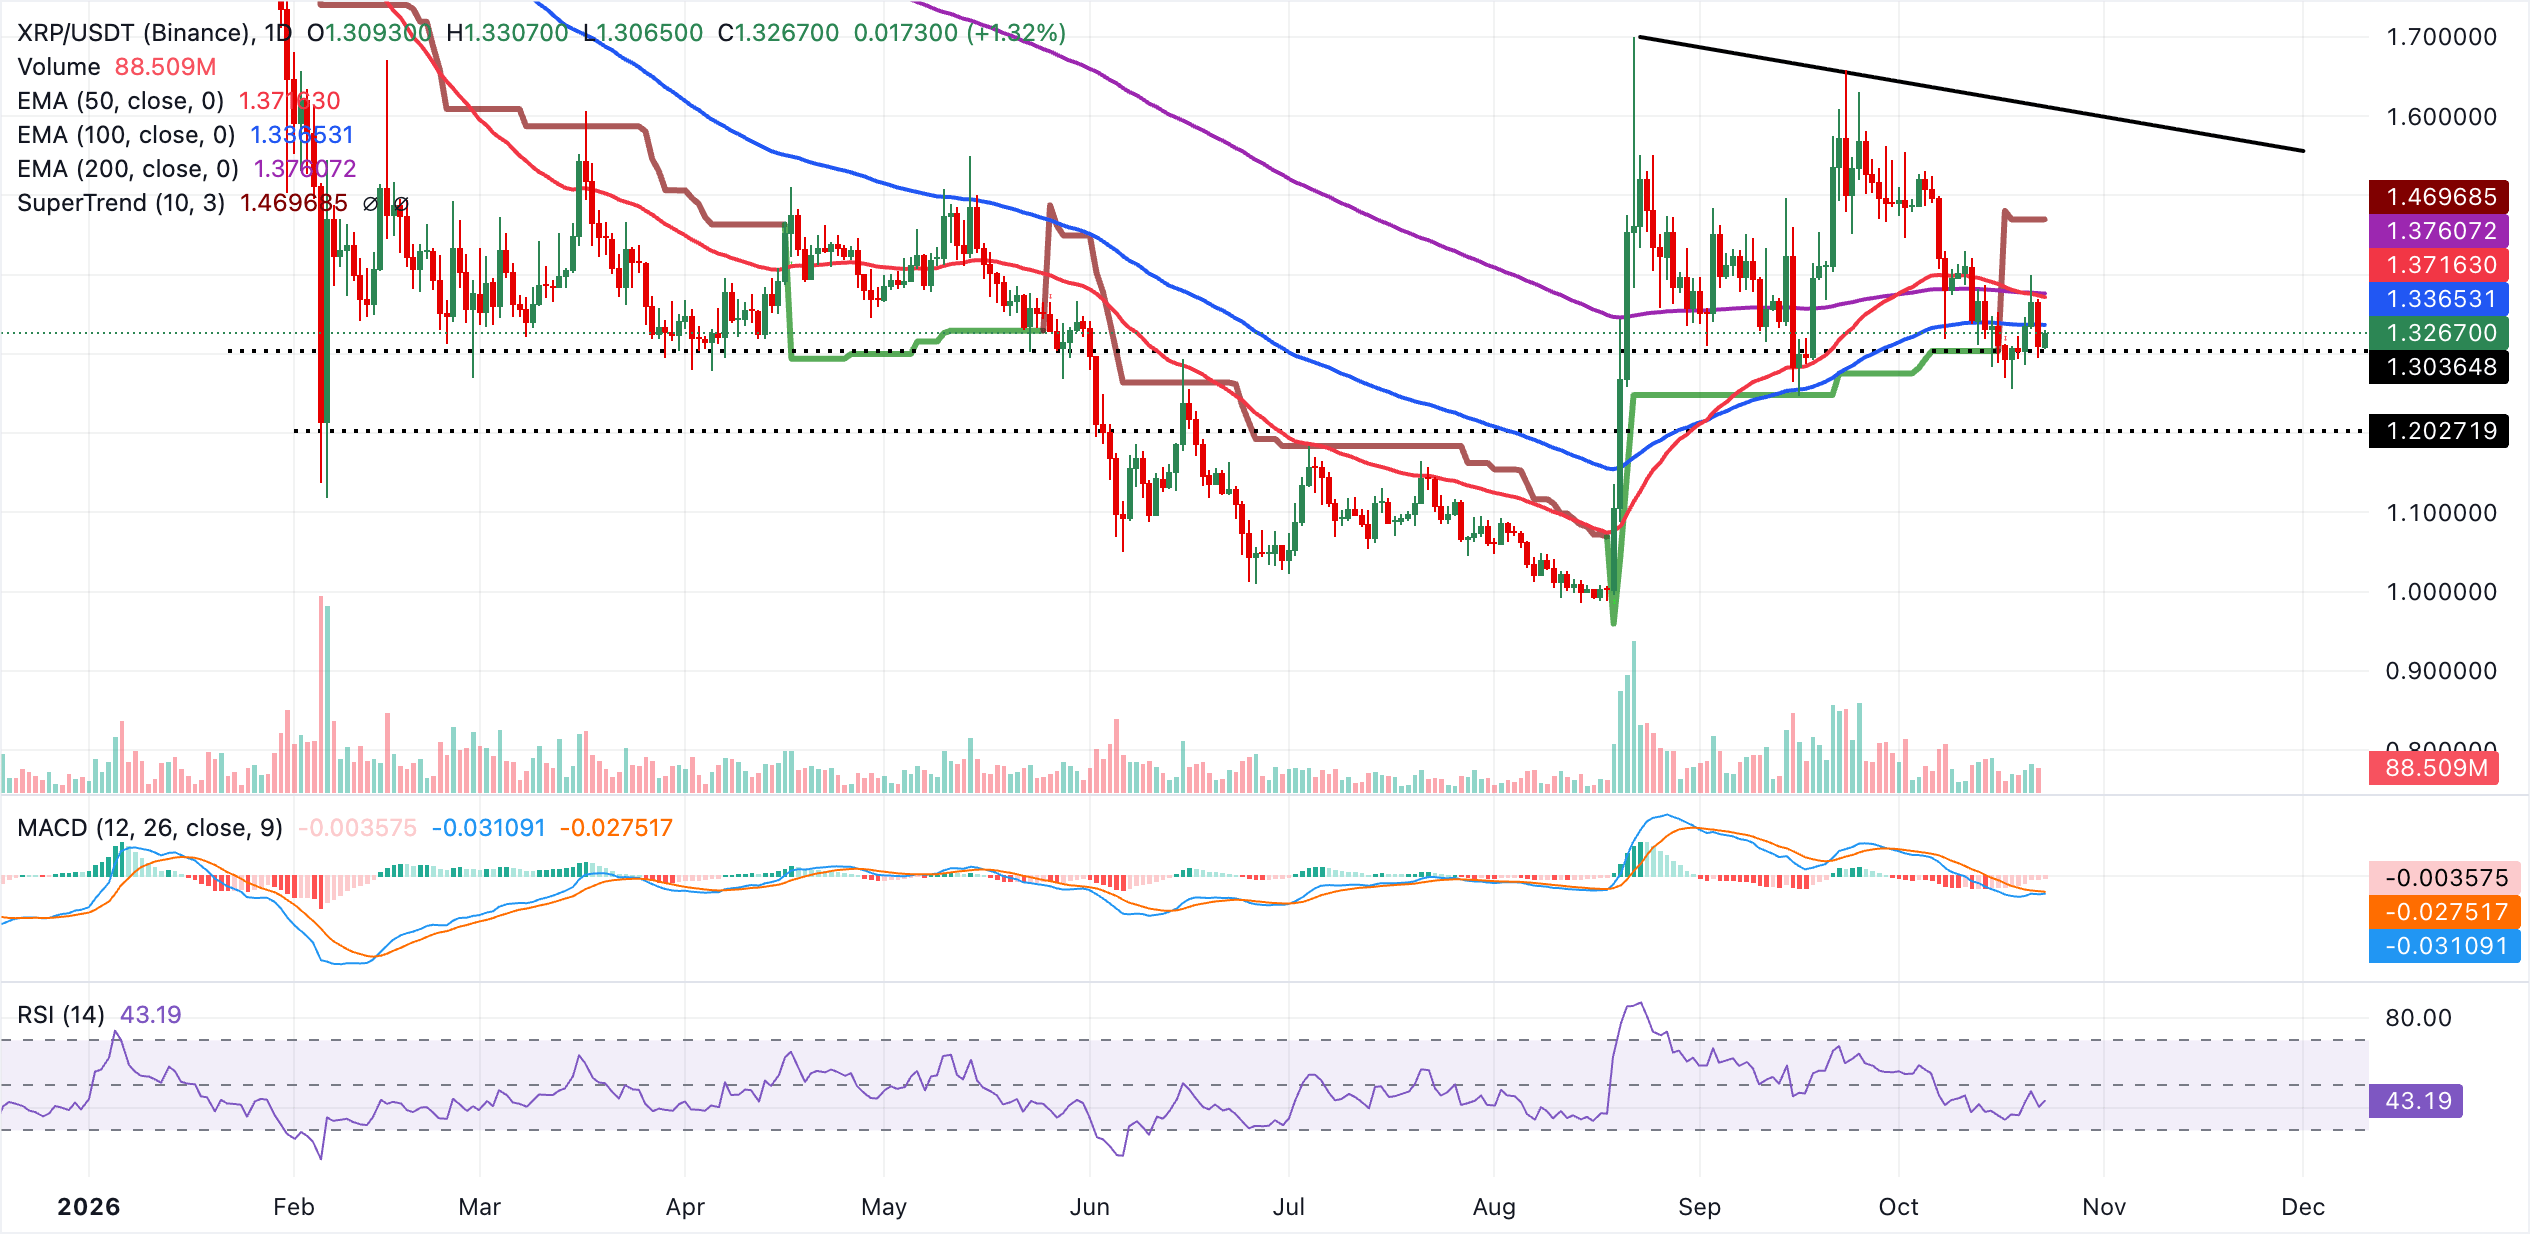
Initial resistance emerges at the 100-day EMA at $1.34, where a sustained close above would be needed to ease immediate selling pressure. Higher, the 50-day EMA at $1.37 and the 200-day EMA at $1.38 form a dense supply band, and only a decisive move through this cluster would signal a more durable recovery. The SuperTrend barrier at $1.47 marks a key medium-term hurdle.
On the downside, the absence of nearby moving-average or trendline support on the daily chart leaves the pair exposed to renewed selling if momentum fades.
(The technical analysis of this story was written with the help of an AI tool. Know more.)
Crypto ETF FAQs
An Exchange-Traded Fund (ETF) is an investment vehicle or an index that tracks the price of an underlying asset. ETFs can not only track a single asset, but a group of assets and sectors. For example, a Bitcoin ETF tracks Bitcoin’s price. ETF is a tool used by investors to gain exposure to a certain asset.
Yes. The first Bitcoin futures ETF in the US was approved by the US Securities & Exchange Commission in October 2021. A total of seven Bitcoin futures ETFs have been approved, with more than 20 still waiting for the regulator’s permission. The SEC says that the cryptocurrency industry is new and subject to manipulation, which is why it has been delaying crypto-related futures ETFs for the last few years.
Yes. The SEC approved in January 2024 the listing and trading of several Bitcoin spot Exchange-Traded Funds, opening the door to institutional capital and mainstream investors to trade the main crypto currency. The decision was hailed by the industry as a game changer.
The main advantage of crypto ETFs is the possibility of gaining exposure to a cryptocurrency without ownership, reducing the risk and cost of holding the asset. Other pros are a lower learning curve and higher security for investors since ETFs take charge of securing the underlying asset holdings. As for the main drawbacks, the main one is that as an investor you can’t have direct ownership of the asset, or, as they say in crypto, “not your keys, not your coins.” Other disadvantages are higher costs associated with holding crypto since ETFs charge fees for active management. Finally, even though investing in ETFs reduces the risk of holding an asset, price swings in the underlying cryptocurrency are likely to be reflected in the investment vehicle too.
Recommended Articles


