Pi Network Price Forecast: PI holds modest gains as mixed technicals curb upside

Source Fxstreet
  • Pi Network is up nearly 2% on Friday, holding above the $0.0744 support level and extending its consolidation range.
  • The Fear and Greed Index at 49 amid rising long liquidations suggests neutral-to-bearish crypto market sentiment.
  • Pi Network’s technical outlook is mixed as the price approaches a long-term resistance trendline at $0.0823.

Pi Network (PI) price is up 2% on Friday, showing signs of recovery while the broader cryptocurrency market faces near-term weakness. The crypto market sentiment eases to neutral from bullish amid rising long liquidations. Pi Network's price must surpass the overhead trendline near $0.0823 to sustain an upward trend.

Crypto market loses bullish traction

The broader cryptocurrency market shows signs of easing investors’ risk appetite. The Fear and Greed Index slips to 49 on Friday, down from 69 on October 1, indicating that bullish sentiment is easing toward neutral levels. 

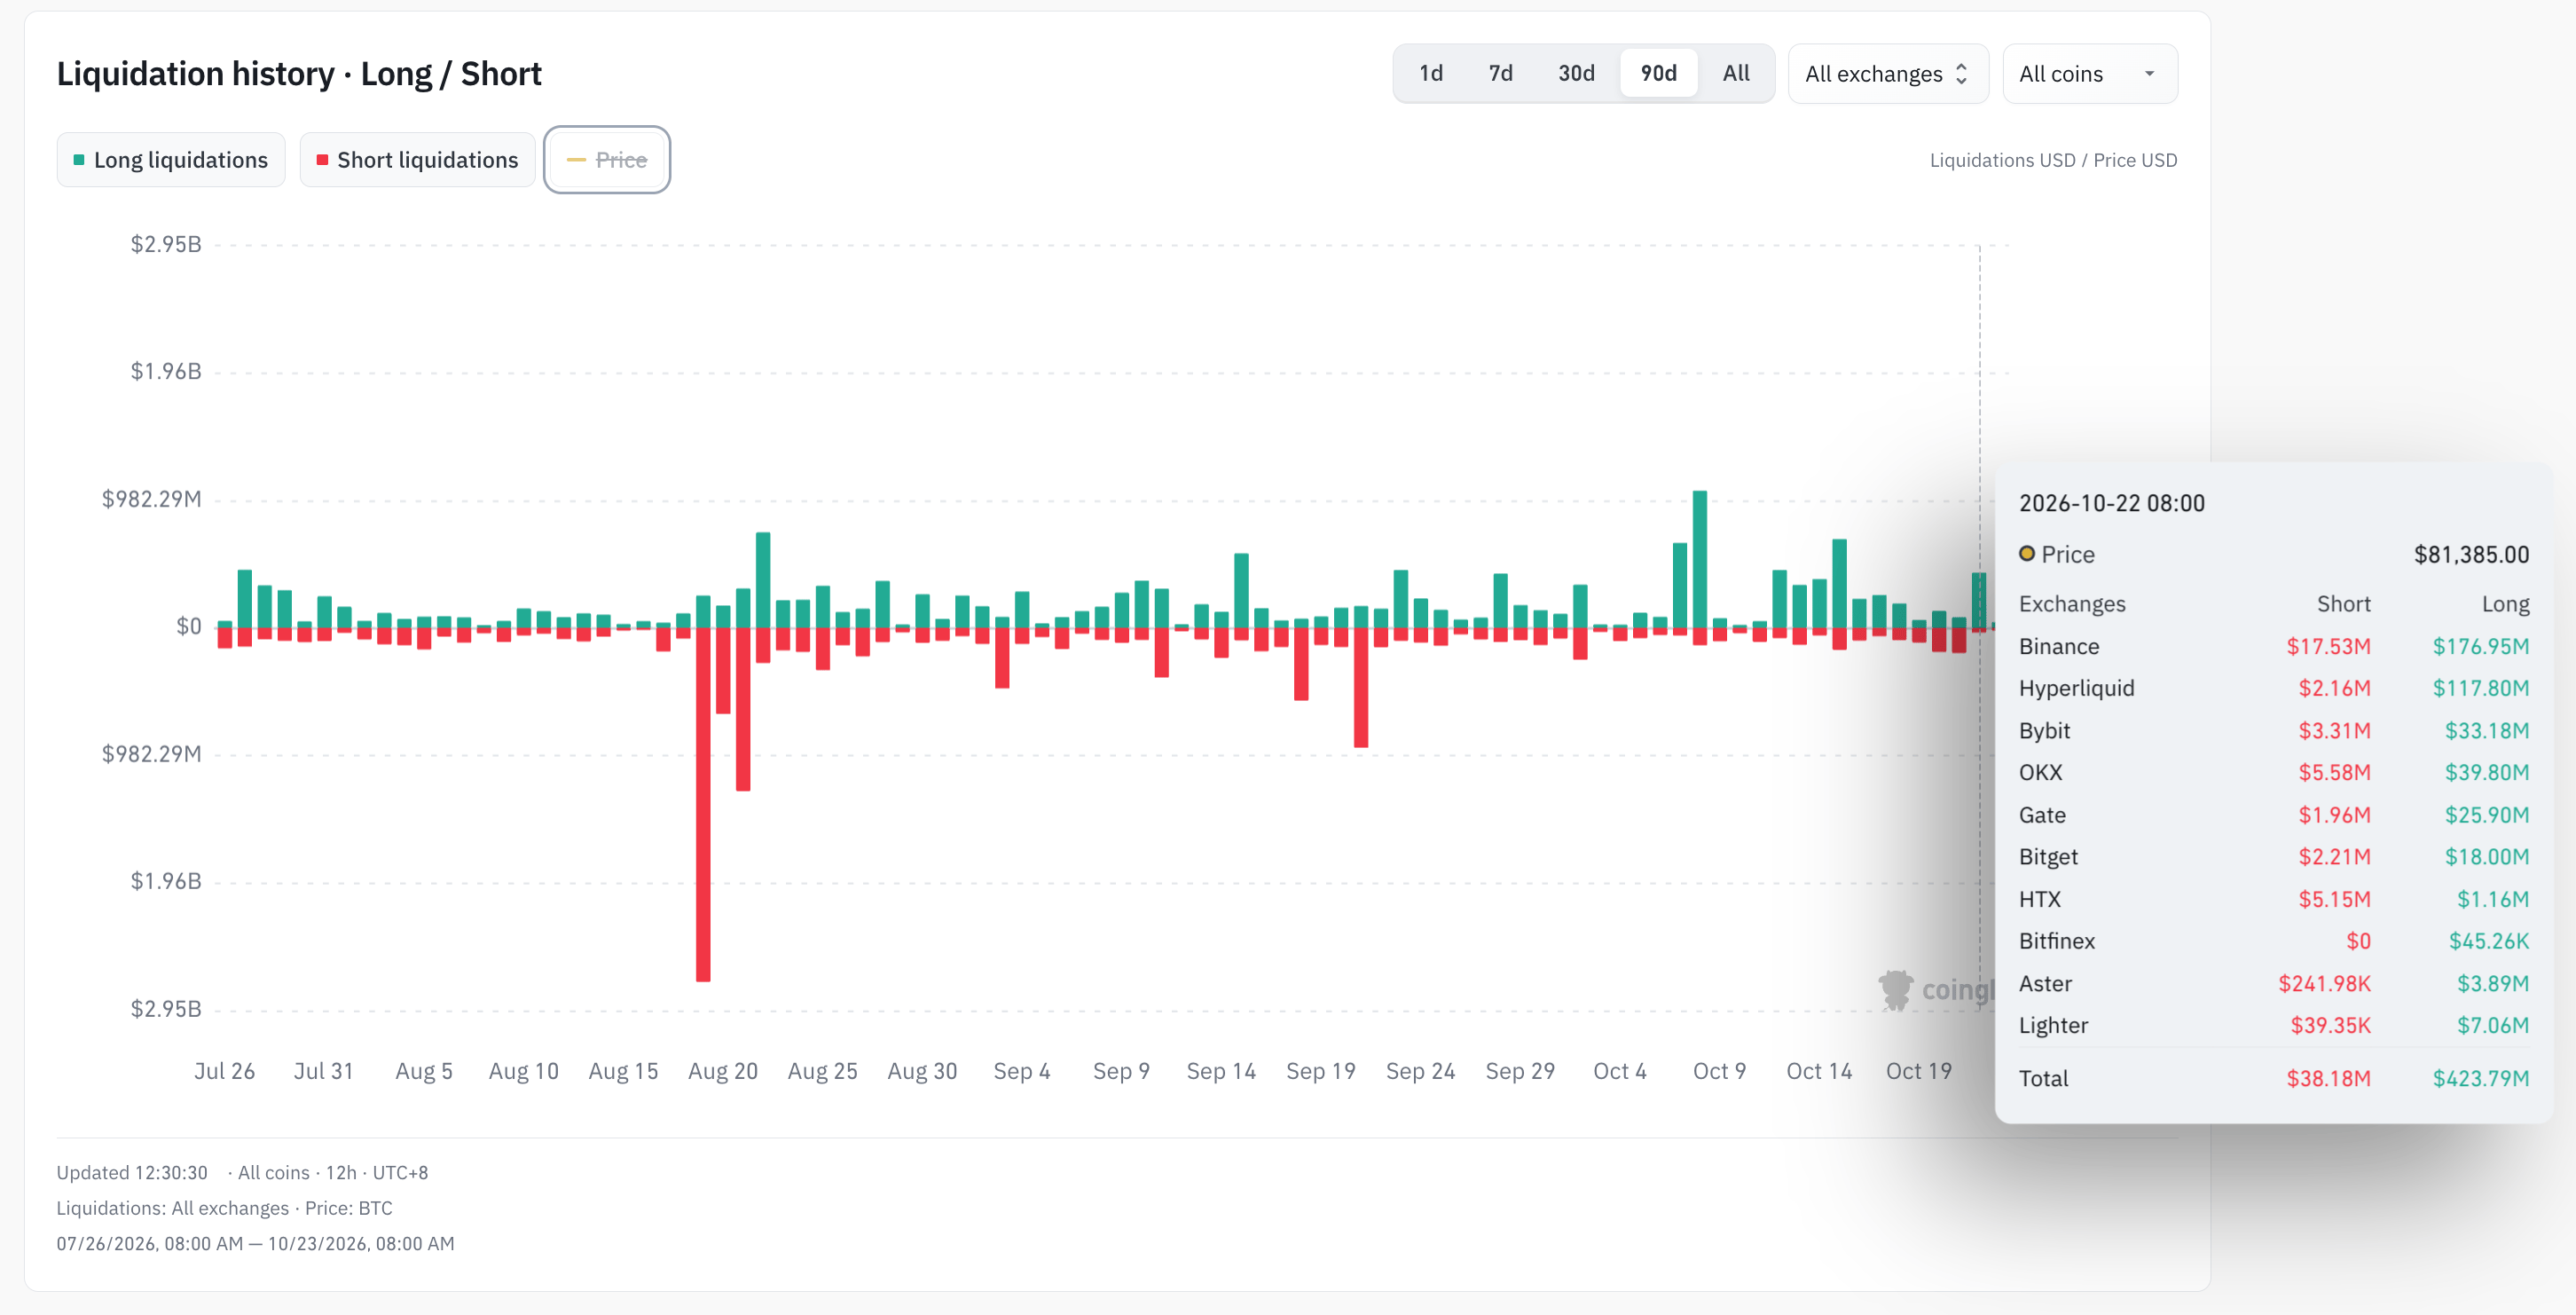
On the other hand, CoinGlass data shows $423 million in long liquidation on Thursday, compared to $38.18 million in short liquidation, suggesting sell-side dominance. Taken together, the buy-side weakness aligns with the heightened unwinding of long positions. 
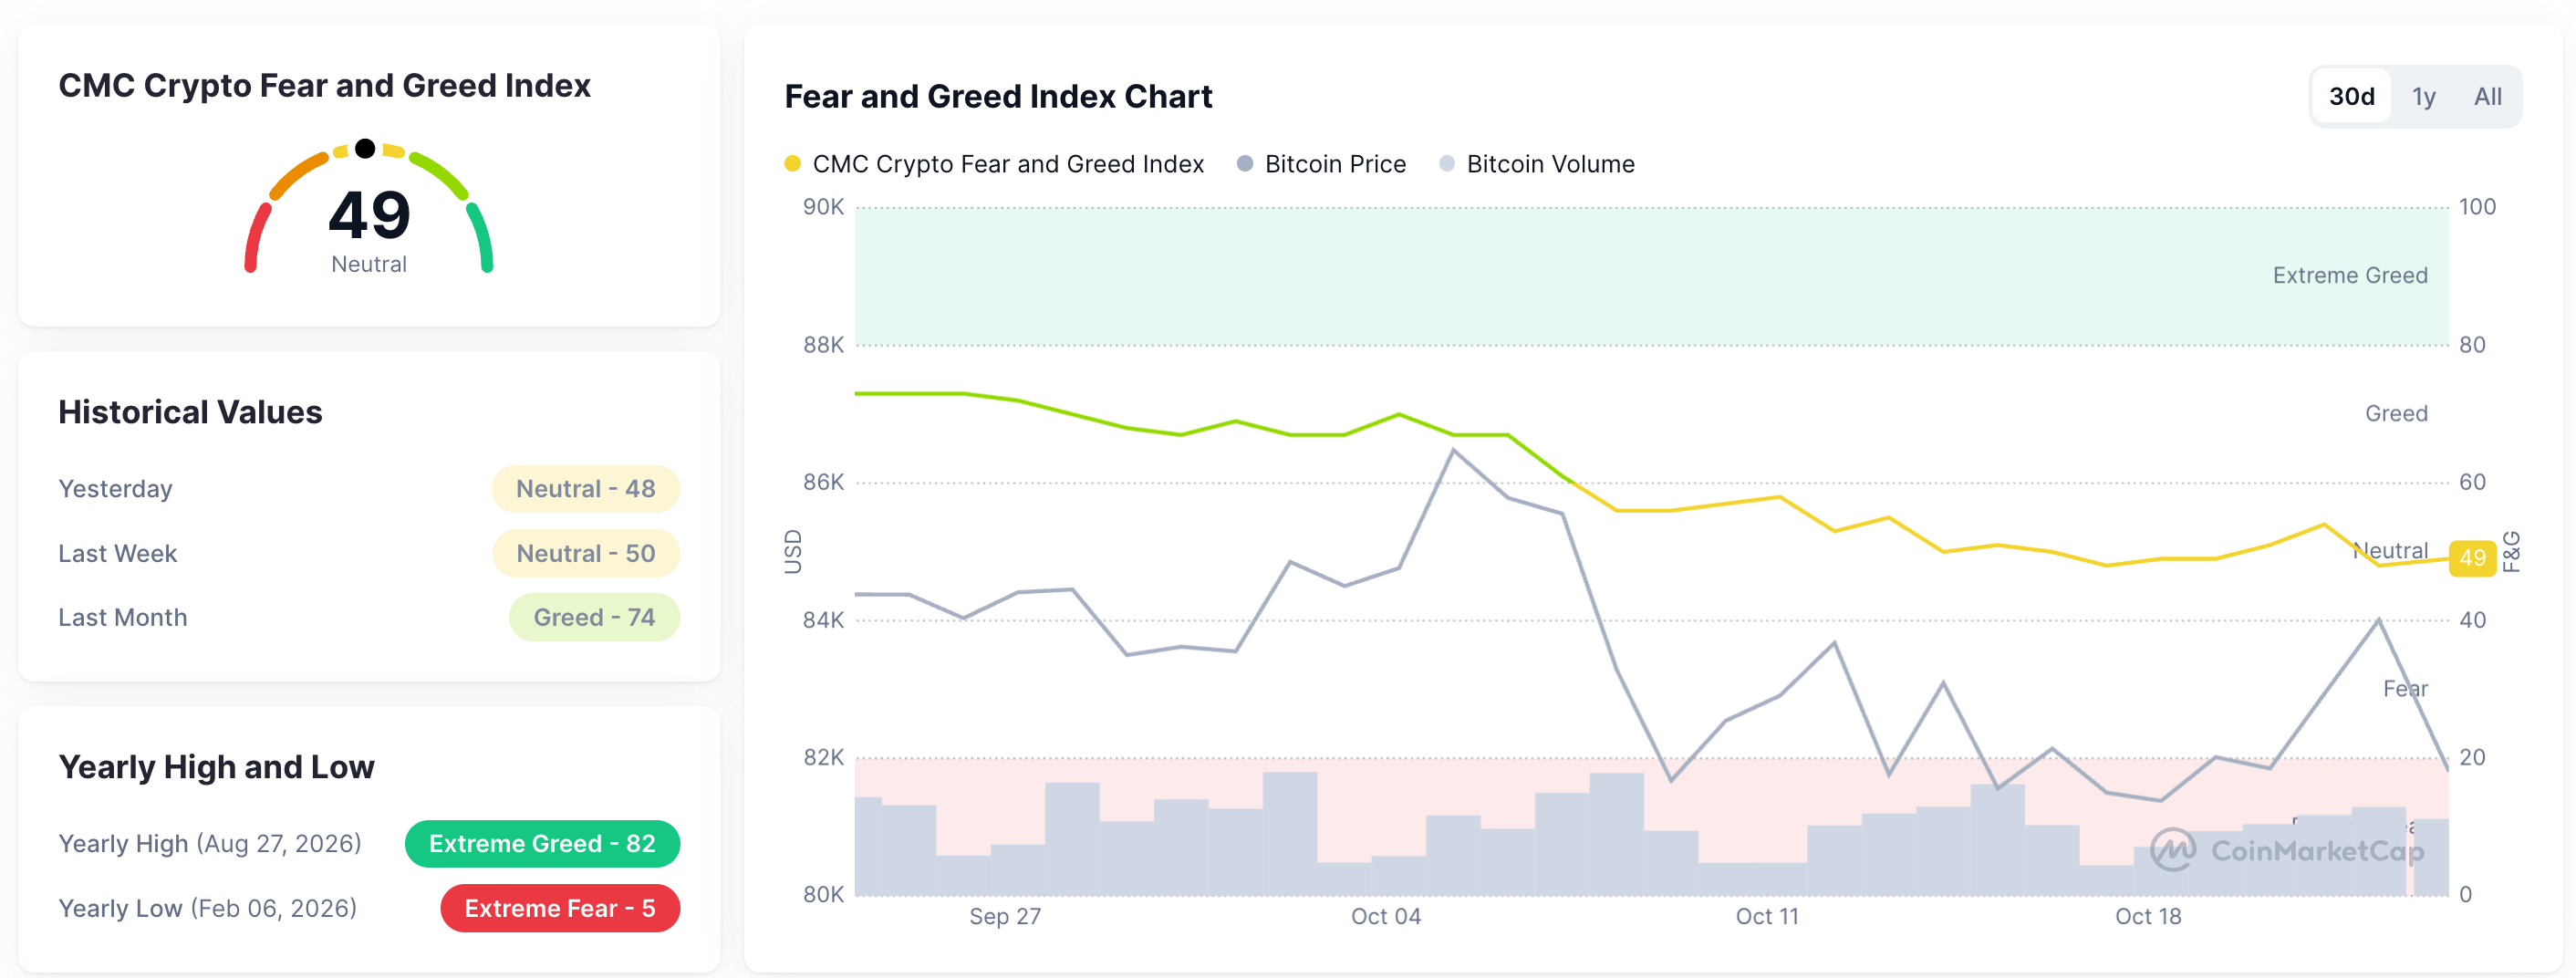
Fear and Greed Index. Source: CoinMarketCap
Crypto liquidation data. Source: CoinGlass

Technical outlook: Will Pi Network regain a bullish trend?

Pi Network trades at $0.0800 at press time on Friday, showing another bullish rebound attempt from the $0.0774 support level. The PI token maintains a bearish near-term bias as the price remains capped below the declining resistance trendline, connecting the June 20 and August 22 highs around $0.0823.

In addition, the price sits below the 50-period Exponential Moving Average (EMA) at $0.0855 and the 200-period EMA near $0.1228, reinforcing a capped tone. A confirmed breakout above the trendline at $0.0823 could extend the rally toward the 50-period EMA at $0.0855, which is reinforced by the 23.6% Fibonacci retracement at $0.0866, measured from $0.1394 to $0.0704.

Momentum gains mild upward traction on the daily chart, with Moving Average Convergence Divergence (MACD) marginally rising above its signal line, while the Relative Strength Index (RSI) is around 43, hinting at stabilization rather than a decisive recovery.

PI/USD daily price chart.

On the downside, the next meaningful support is at the October 8 low of $0.0774, followed by the Fibonacci cycle low around $0.0704, where buyers could attempt to build a more durable base if the current slide continues.

(The technical analysis of this story was written with the help of an AI tool. Know more.)

Disclaimer: For information purposes only. Past performance is not indicative of future results.
placeholder
Bank of America Sets a New Target For Gold Price By the End of 2026Bank of America (BofA) expects gold below $4,000 over the next three months. The bank forecasts an average of $4,000 per ounce in the fourth quarter.Gold traded around $4,100 on Wednesday after hotter
Author  FXStreet
Oct 15, Thu
Bank of America (BofA) expects gold below $4,000 over the next three months. The bank forecasts an average of $4,000 per ounce in the fourth quarter.Gold traded around $4,100 on Wednesday after hotter
placeholder
What History Says Happens After Chip Stocks Have a Week This BadBTIG has told investors to use any rebound in semiconductor stocks to cut their exposure. The firm expects a drawn-out decline in the sector that could stretch into 2027.The warning followed an 11.4%
Author  Beincrypto
Oct 20, Tue
BTIG has told investors to use any rebound in semiconductor stocks to cut their exposure. The firm expects a drawn-out decline in the sector that could stretch into 2027.The warning followed an 11.4%
placeholder
Will Brent Jump 28% Again? US and Israel Draft Post-Midterm Iran Strike PlansThe US and Israel have drafted plans for Iran strikes after the Nov. 3 midterms, The New York Times reports. Energy sites appear on the reported target list, with Brent crude already near $109 a barre
Author  Beincrypto
Yesterday 01: 44
The US and Israel have drafted plans for Iran strikes after the Nov. 3 midterms, The New York Times reports. Energy sites appear on the reported target list, with Brent crude already near $109 a barre
placeholder
Is Bitcoin on the Verge of a Deeper Correction? The S&P 500 May Hold the AnswerBitcoin is consolidating near $82,000 to $83,000 after retreating from recent highs above $87,000. A new CryptoQuant analysis warns that the S&P 500 is showing similar weakness.Analysts are split on w
Author  Beincrypto
Yesterday 01: 48
Bitcoin is consolidating near $82,000 to $83,000 after retreating from recent highs above $87,000. A new CryptoQuant analysis warns that the S&P 500 is showing similar weakness.Analysts are split on w
placeholder
Market News Today Australia: Nasdaq Rallies, Gold Rebounds as Meta Earnings BeatNasdaq rises 1.05%, Meta reports strong earnings and gold rebounds. Explore today's Australian market outlook for oil, AUD/USD and the ASX 200.
Author  Mitrade Team
Yesterday 03: 12
Nasdaq rises 1.05%, Meta reports strong earnings and gold rebounds. Explore today's Australian market outlook for oil, AUD/USD and the ASX 200.
goTop
quote