




EUR/USD Price Forecast: 200-week SMA offers last line of defense against deeper losses
- EUR/USD remains under pressure as a firmer US Dollar and France’s fiscal concerns weigh on the Euro.
- The weekly chart retains a bearish bias as the pair trades below key moving averages.
- RSI approaches oversold territory, with the 200-week SMA emerging as key support.
EUR/USD trades on the back foot on Friday as the US Dollar (USD) regains some ground alongside US Treasury yields following Thursday’s decline. France’s fiscal concerns add pressure on the Euro (EUR), while traders look ahead to next week’s Federal Reserve (Fed) and European Central Bank (ECB) interest rate decisions.
At the time of writing, the pair trades around 1.1190, down 0.22% on the day. Meanwhile, the US Dollar Index (DXY), which tracks the Greenback's value against a basket of six major currencies, trades around 101.82 after touching a three-week low of 101.45 on Thursday.
Fed and ECB seen pausing now but primed for December rate hikes
Economists at Commerzbank argue that “the Fed and the ECB thus have good reasons to pause in October, not least to gain more clarity on the economic and geopolitical conditions.” Looking ahead, they expect policy tightening to resume, with the bank judging that “in December, however, both central banks are likely to respond to persistently high inflation and raise interest rates—as priced in by the futures markets—by 25 basis points.” Commerzbank stresses that this guidance is not without caveats, adding that “the forecast for the ECB is contingent on the situation in the French government bond market not escalating.”
Technical analysis: Weekly chart
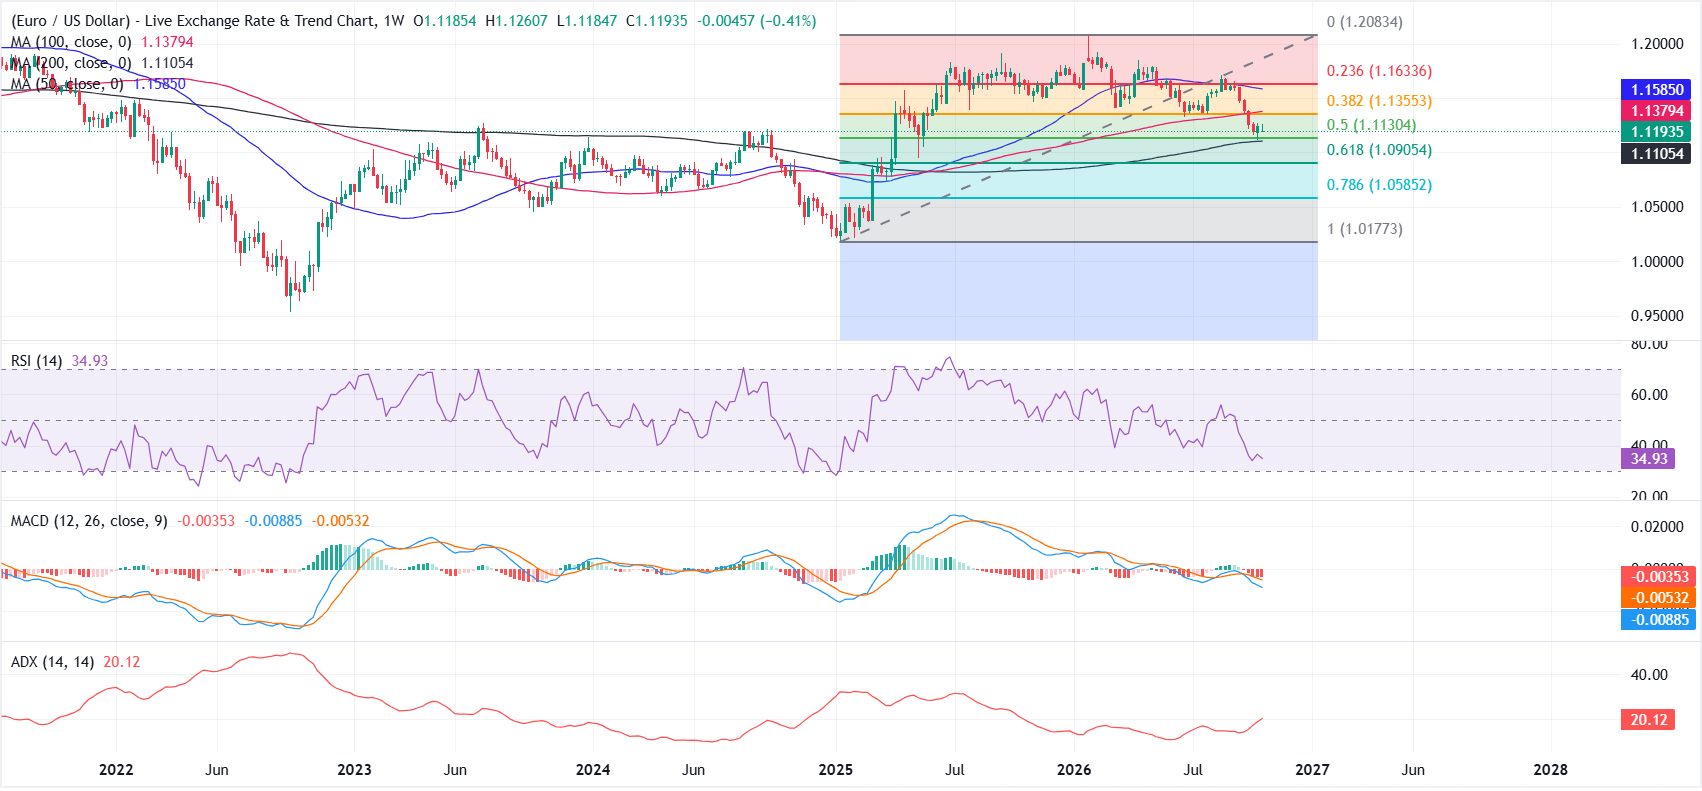
EUR/USD holds marginally above the 200-week Simple Moving Average (SMA) at 1.1105 but remains below the 50-week SMA at 1.1585 and the 100-week SMA at 1.1379, leaving sellers in control..
The pair also trades below the 38.2% Fibonacci retracement at 1.1355 and the 23.6% retracement at 1.1634, reinforcing a topside cap, while the Relative Strength Index (RSI) at 34 hovers just above oversold territory and the Moving Average Convergence Divergence (MACD) remains negative, both suggesting persistent, though not extreme, selling pressure within a modest trend environment indicated by the Average Directional Index (ADX) around 20.
On the downside, initial support emerges near the 50.0% Fibonacci retracement at 1.1130, closely followed by the 200-week SMA at 1.1105, with deeper bearish extension exposing the 61.8% retracement at 1.0905 and the 78.6% level at 1.0585 before the structural floor around the 100.0% retracement at 1.0177.
On the topside, a first hurdle is seen at the 38.2% Fibonacci retracement at 1.1355, ahead of the 100-week SMA at 1.1379, while a more meaningful recovery would require a weekly close above the 50-week SMA at 1.1585 and the 23.6% retracement at 1.1634, which together define a dense resistance band capping the broader rebound.
(The technical analysis of this story was written with the help of an AI tool. Know more.)
Euro Price This week
The table below shows the percentage change of Euro (EUR) against listed major currencies this week. Euro was the strongest against the US Dollar.
| USD | EUR | GBP | JPY | CAD | AUD | NZD | CHF | |
|---|---|---|---|---|---|---|---|---|
| USD | -0.07% | -0.45% | -0.74% | -0.83% | -1.12% | -0.74% | -0.11% | |
| EUR | 0.07% | -0.35% | -0.65% | -0.72% | -0.96% | -0.64% | -0.01% | |
| GBP | 0.45% | 0.35% | -0.29% | -0.36% | -0.58% | -0.29% | 0.40% | |
| JPY | 0.74% | 0.65% | 0.29% | -0.08% | -0.39% | -0.00% | 0.75% | |
| CAD | 0.83% | 0.72% | 0.36% | 0.08% | -0.30% | 0.13% | 0.77% | |
| AUD | 1.12% | 0.96% | 0.58% | 0.39% | 0.30% | 0.31% | 0.97% | |
| NZD | 0.74% | 0.64% | 0.29% | 0.00% | -0.13% | -0.31% | 0.68% | |
| CHF | 0.11% | 0.01% | -0.40% | -0.75% | -0.77% | -0.97% | -0.68% |
The heat map shows percentage changes of major currencies against each other. The base currency is picked from the left column, while the quote currency is picked from the top row. For example, if you pick the Euro from the left column and move along the horizontal line to the US Dollar, the percentage change displayed in the box will represent EUR (base)/USD (quote).
Recommended Articles


