


Microsoft Stock Price Forecast: AI Demand Is Turning Into Real Cloud Revenue, Shares May Return to $500
TradingKey - Microsoft ( MSFT) saw its stock price climb past the $460 mark after releasing its fourth-quarter fiscal 2026 earnings report, leaving it just a $1 gain away from its previous high of $466.32. Looking at the financial results, the key catalyst driving the stock price higher is that it proved AI monetization has entered an accelerated track, which also indirectly demonstrates that investors' focus on the return on AI investment has risen further.
Why Is Microsoft Stock Rising?
The most critical point in Microsoft's entire earnings report, and the most important driver behind its stock price rally, is the sustainability of AI monetization.
One of the key metrics proving this is that Azure and other cloud services revenue grew 43% year-over-year, significantly higher than the market expectation of approximately 40%. Against the backdrop of intensifying competition among major cloud providers and market concerns over whether AI demand can materialize, this growth rate significantly boosted investor confidence. Microsoft CEO Satya Nadella disclosed during the conference call that Azure's full-fiscal-year revenue exceeded $100 billion for the first time, calling it "a significant milestone." Azure is no longer just the growth engine in Microsoft's cloud transition, but has become a core business with massive scale that still maintains high growth within its revenue structure.
On the other hand, overall Microsoft Cloud revenue reached $59.3 billion, up 27% year-over-year, also beating market expectations of $58.71 billion. Within this, Microsoft 365 Commercial Cloud revenue grew 14%, and Consumer Cloud grew 24%, indicating that Microsoft does not rely solely on Azure infrastructure demand, and that its office software and enterprise collaboration ecosystem also continue to expand steadily.
Another piece of evidence is Microsoft Cloud's commercial remaining performance obligation (RPO). This metric surged 84% year-over-year to $678 billion, representing the value of contracted work that has yet to be recognized as revenue, covering long-term commitments for Azure, Microsoft 365, and other enterprise services. The scale of $678 billion is approximately twice Microsoft's fiscal year 2026 revenue scale of $331.8 billion. It indicates that enterprise customers are signing longer-term, larger-scale cloud and software contracts with Microsoft, providing high visibility for future revenue growth. Microsoft's enterprise AI ecosystem is moving from "proof of concept" to "budget allocation." This is an important signal for the market, as the valuation of the AI theme must ultimately be supported by real orders and long-term revenue.
Finally, Microsoft executives stated during the conference call that the full-year spending forecast remains around $190 billion, but due to a change in accounting methods (adjusting the estimated useful lives of datacenters and office buildings), the adjusted scale dropped to approximately $175 billion, nearly 8% lower than the original guidance. This change has, to some extent, eased market concerns over out-of-control AI spending.
Will Microsoft Stock Continue to Rise?
In terms of the catalyst from this event, Microsoft proved that enterprise AI demand is translating into actual cloud revenue, reversing the prior panic over AI spending. This also drove a rebound in previously battered AI hardware stocks.
From an investment thesis standpoint, the bullish view is that if Azure growth continues to accelerate and Copilot penetration keeps rising, the market will be more willing to tolerate high AI capital expenditures.
Conversely, if cloud growth slows in the future while spending remains elevated, valuation pressures could mount once again. Although this quarterly report reinforced Microsoft's leadership in AI and cloud computing, it also shifts the spotlight further to the coming quarters—namely, whether Microsoft can continue to prove that every dollar of AI capital expenditure can generate substantial cloud revenue, enterprise software revenue, and long-term contract growth.
Therefore, from a fundamental perspective, the upside potential for Microsoft's stock price far outweighs the downside, though the crux depends on whether Azure's growth rate can be sustained.
During the conference call, Nadella highlighted the company's progress on the 'cost-to-outcome curve,' stating the goal of ensuring that every customer can translate tokens into actual business outcomes. With Azure demand continuing to outstrip available capacity, the supply-demand imbalance shows no signs of easing in the near term, which also means the growth ceiling has not yet been reached.
Microsoft Stock Price Forecast
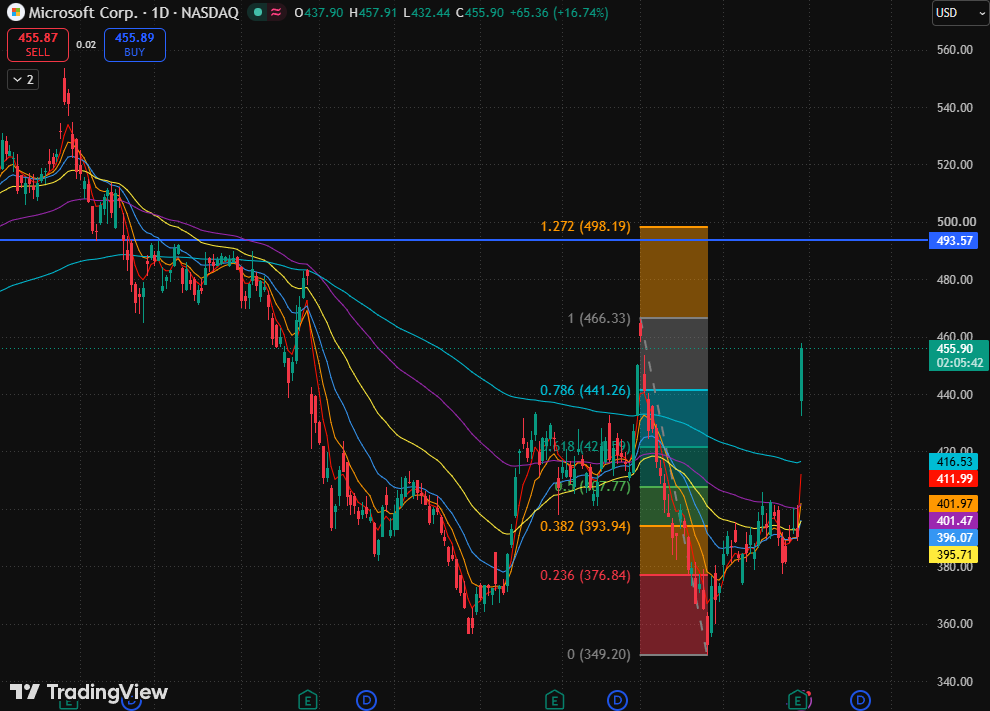
Microsoft daily stock price chart, Source: TradingView
Looking at Microsoft's stock price chart, after hitting a periodic high of $466.32 on June 1, it fell all the way to $349.2 on June 25, representing a cumulative decline of approximately 22%. However, buoyed by positive earnings results today, Microsoft's stock price strongly broke through the key technical resistance at the Fibonacci 0.786 level ($441.26).
From the perspective of moving averages, all moving averages are located below the price, presenting a perfect bullish alignment. In the short term, the focus should be on whether the stock price can return above $466.33. If it effectively breaks through this level, the upside potential will open up to the $494-$500 range (encompassing the Fibonacci 1.272 extension level, resistance level, and round-number psychological barrier).
It is worth noting that following a single-day surge, short-term overbought risks are significant. If the stock price cannot effectively break through $466.33, a profit-taking technical pullback may occur, retracing to the Fibonacci 0.786 level ($441.26) to seek support confirmation.
Recommended Articles


