


Prediction: The Stock Market Will Hit Big Trouble in August. Here's How Much the S&P 500 Will Drop if History Repeats.
Key Points
Since 1950, the S&P 500 has suffered an average peak-to-trough decline of 18% during midterm election years.
The market expects the Federal Reserve to raise its benchmark rate by a quarter percentage point this year.
When interest rates rise, investors become less willing to buy risky stocks as safer bonds get more attractive.
- 10 stocks we like better than S&P 500 Index ›
The U.S. stock market has historically performed poorly in August. In fact, over the last three decades, the S&P 500 (SNPINDEX: ^GSPC) has declined by an average of 0.5% during the month. The benchmark index has only done worse in September, falling by an average of 0.7%.
Unfortunately, August could be particularly brutal this year. Not only does it mark the sixth month of the Iran war, which has created enough inflationary pressure that the market now anticipates higher interest rates, but also the S&P 500 has often dropped into correction territory in August during midterm election years.
Missed Nvidia in 2009? This Rare Signal Is Flashing Again. In 2009, a "Double Down" signal flashed for a little-known chipmaker called Nvidia. For the first time in years, that same "Total Conviction" signal is flashing for a company 1/100th the size of Nvidia. Continue »
Here's what investors need to know.
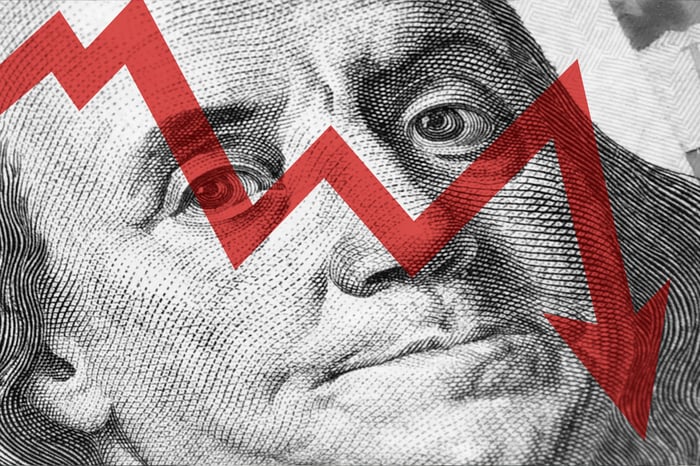
Image source: Getty Images.
The S&P 500 tends to drop sharply during midterm election years, and the bottom usually comes in August
Midterm elections create uncertainty because the president's party usually loses seats in Congress, which raises questions about future fiscal, trade, and regulatory policy. In fact, dating back to 1950, the president's party has lost an average of 24 seats in the House and three seats in the Senate during midterm elections.
Some investors choose to navigate that uncertainty by pulling money out of stocks. Since 1950, the S&P 500 has suffered an average peak-to-trough decline of 18% during midterm election years, meaning the benchmark index for the U.S. stock market has usually fallen into correction territory. And those corrections, on average, hit bottom in August, according to Carson Investment Research.
So what? The S&P 500 closed at a record high of 7,910 on June 2. If the index's performance aligns with the historical average, it will decline 18% from that peak to 6,240 at some point before the year ends. That implies about 16% downside from its current level of 7,467. And history says the bottom could come in August.
Of course, past performance is not a guarantee of future results, but a stock market decline around midterms is particularly plausible this year for two reasons. First, recent polls show Democrats could take control of the House, which would make it nearly impossible for President Trump to pass legislation. Second, investors are simultaneously concerned that the Federal Reserve will raise its benchmark interest rate to combat inflation created by various economic shocks, especially the Iran war.
Expectations about future interest rate hikes could put more downward pressure on the stock market in August
WTI crude oil prices (the U.S. benchmark) increased about 25% in July after the U.S.-Iran ceasefire collapsed and the two nations resumed fighting. Inflation had already been running above target for about five years, but oil supply disruptions have added to the problem. So, the market expects the Federal Reserve to raise interest rates by a quarter percentage point this year to restore price stability.
Legendary investor Warren Buffett says interest rates are the "most important" variable in stock market valuations. When interest rates are low, investors are willing to pay more for stocks because bonds are unattractive. But the opposite is also true. When interest rates are high, investors are willing to pay less for risky stocks because relatively safe bonds offer reasonably attractive returns.
Since 1987, the Federal Reserve has pivoted from rate cuts to rate hikes nine times, and the U.S. stock market has not performed well in the aftermath. The S&P 500 has declined by an average of 10% at some point during the next three months. If the Fed raises interest rates this year, it will be the 10th pivot from cuts to hikes in the last 40 years.
Here's the big picture: History says the S&P 500 could drop into market correction territory if the Fed raises interest rates. The FOMC does not meet until September, but anticipation of the rate hike could still put downward pressure on the stock market in August, especially because the months leading up to midterm elections have historically been volatile in their own right. That's why the stock market may be headed for trouble in August.
Should you buy stock in S&P 500 Index right now?
Before you buy stock in S&P 500 Index, consider this:
The Motley Fool Stock Advisor analyst team just identified what they believe are the 10 best stocks for investors to buy now… and S&P 500 Index wasn’t one of them. The 10 stocks that made the cut could produce monster returns in the coming years.
Consider when Netflix made this list on December 17, 2004... if you invested $1,000 at the time of our recommendation, you’d have $394,601!* Or when Nvidia made this list on April 15, 2005... if you invested $1,000 at the time of our recommendation, you’d have $1,197,093!*
Now, it’s worth noting Stock Advisor’s total average return is 895% — a market-crushing outperformance compared to 206% for the S&P 500. Don't miss the latest top 10 list, available with Stock Advisor, and join an investing community built by individual investors for individual investors.
See the 10 stocks »
*Stock Advisor returns as of August 1, 2026.
Trevor Jennewine has no position in any of the stocks mentioned. The Motley Fool has no position in any of the stocks mentioned. The Motley Fool has a disclosure policy.
Recommended Articles


