


Pepe Price Forecast: Bearish metrics warn of a steeper decline in PEPE
- Pepe holds steady below the 50-day EMA at $0.00000285, following a 5% loss the previous day.
- Speculative retail demand in PEPE futures eases as the funding rate flips negative amid declining Open Interest.
- On-chain data points to near-term weakness among top holders amid increasing PEPE supply on crypto exchanges.
Pepe (PEPE) price is holding steady on Tuesday, following a 5% drop the previous day. The meme coin is losing its retail strength, with a negative funding rate and declining Open Interest, while on-chain data shows top holders reducing exposure, increasing available supply on crypto exchanges.
Technically, PEPE is on the verge of breaking below a key support level, which could result in roughly 20% downside.
Speculations wane in Pepe
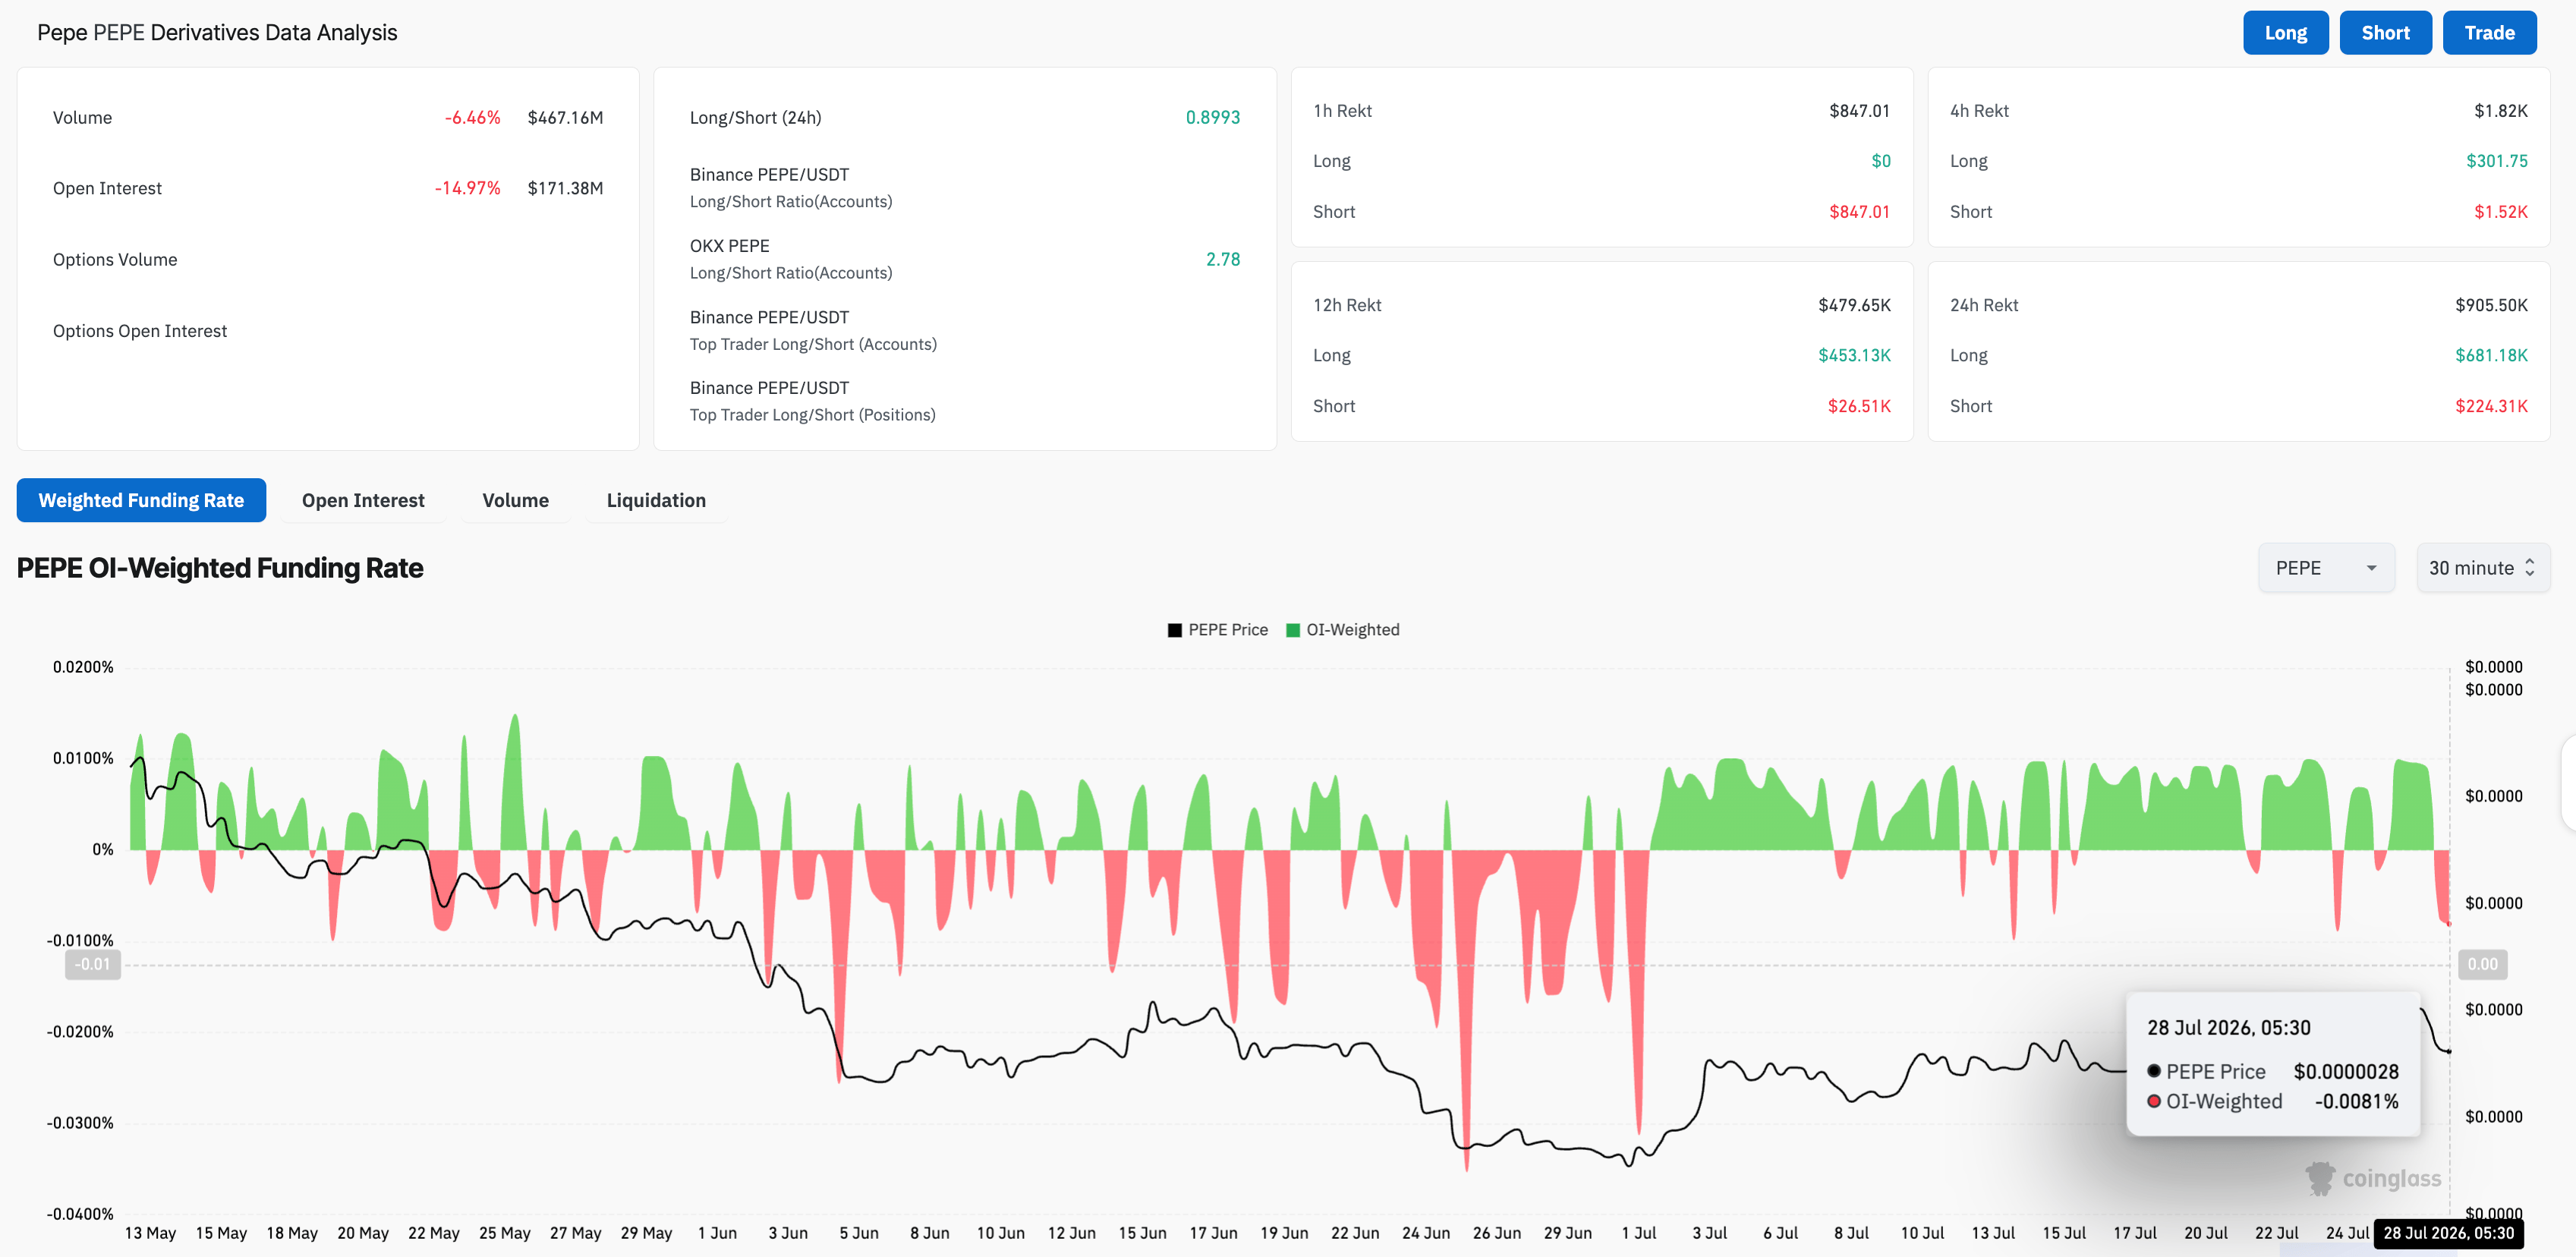
Pepe is losing its mild recovery in retail demand seen over the last three weeks. CoinGlass data show that the 5% drop on Monday coincided with a nearly 15% decline in PEPE futures Open Interest (OI), indicating a reduced notional value of active perpetual contracts. At the same time, the funding rate has dropped to -0.0081%, reaffirming a bearish sentiment among traders.
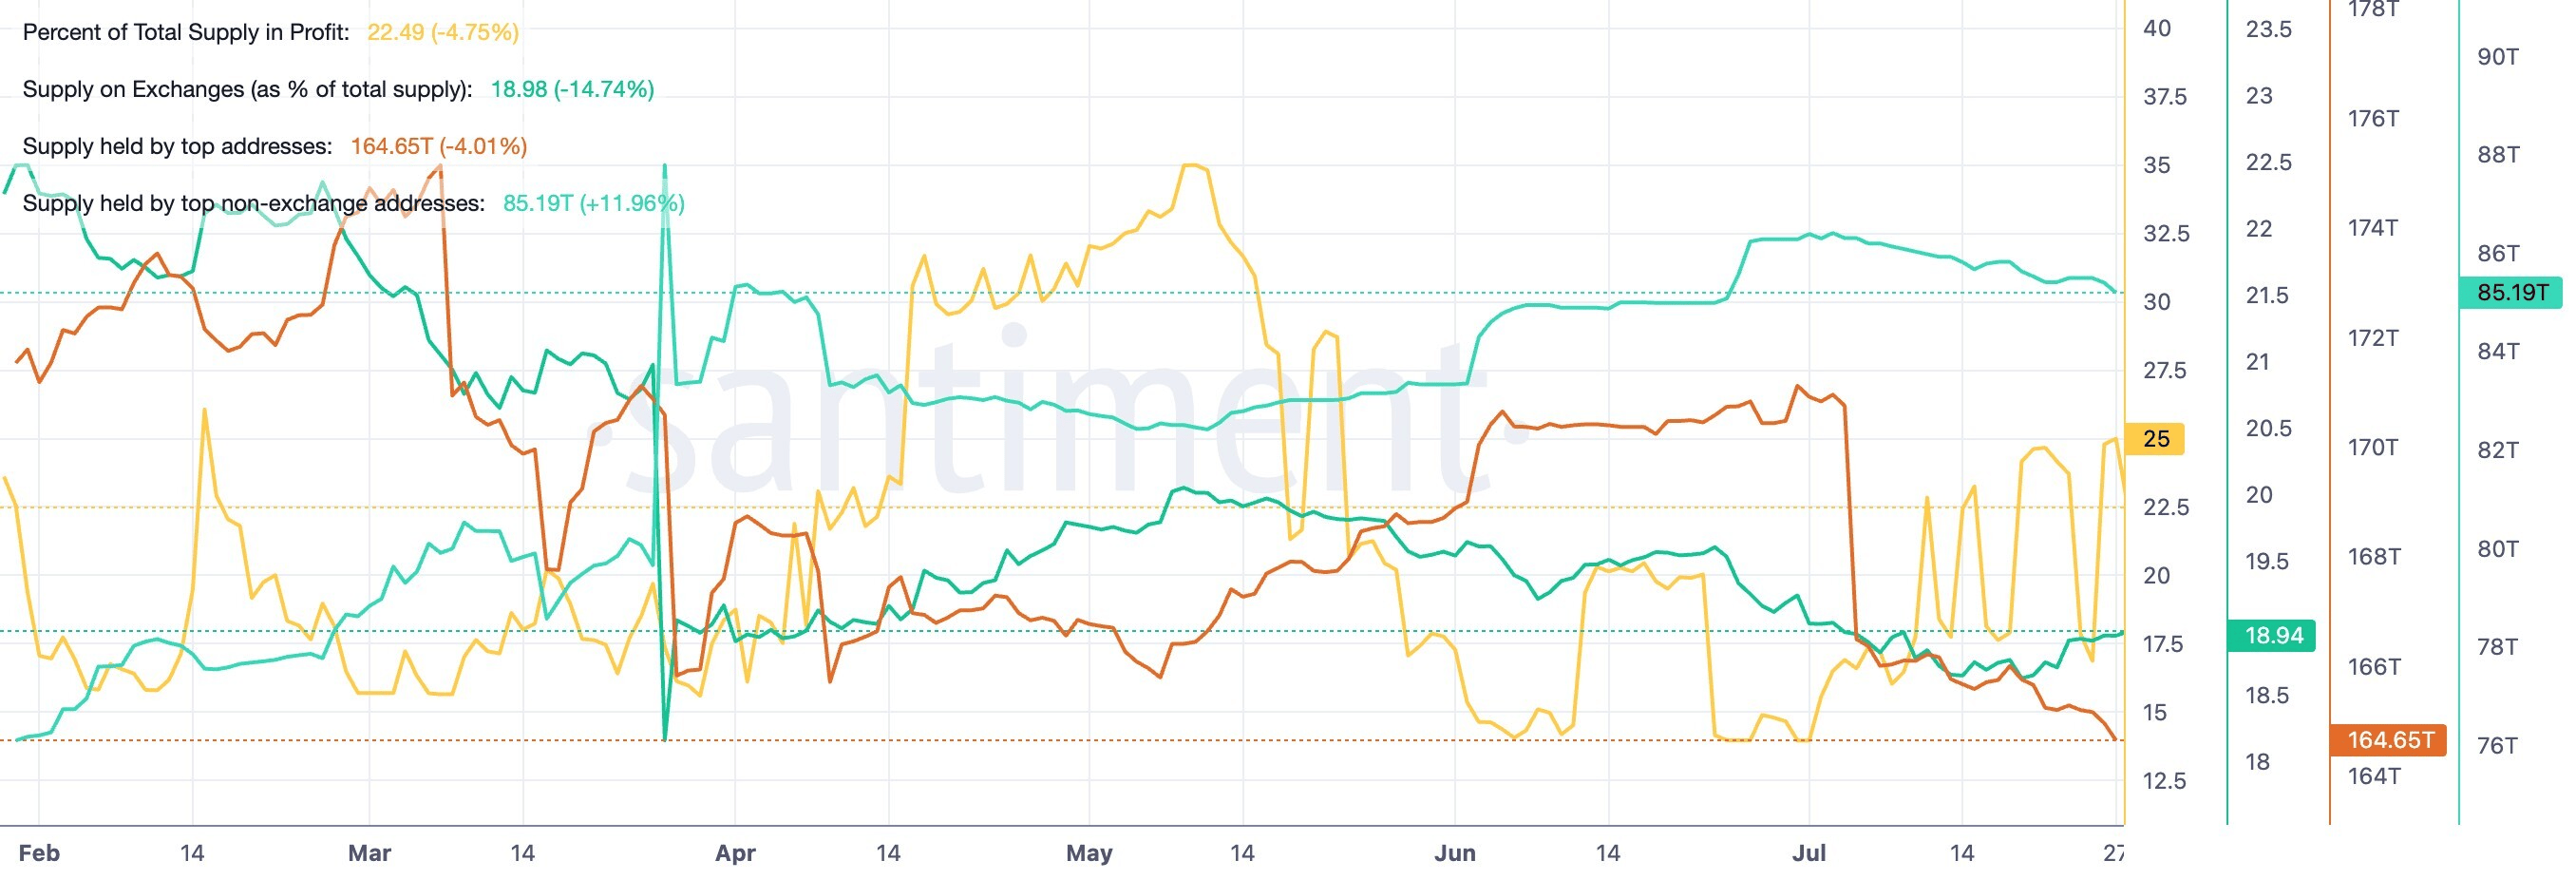
On the on-chain side, the meme coin is losing confidence of its top holders. Santiment data shows the supply held by top addresses was down to 164.65 trillion PEPE on Monday, from 171.12 trillion PEPE on June 30. Meanwhile, the top non-exchange addresses now hold 85.19 trillion, down from 86.38 trillion on July 1.
In addition, the supply on exchanges has increased to 18.94 trillion PEPE, from 18.62 trillion PEPE last week. Together, the on-chain data shows that top holders are reducing their PEPE balance, resulting in increased deposits on exchanges as potential supply pressure.
Technical outlook: Will PEPE take the bearish fall?
Pepe maintains a bearish near-term bias as price remains well below both the 50-day and 100-day Exponential Moving Averages (EMAs) at $0.00000285 and $0.00000311, respectively.
The meme coin tests the 23.6% Fibonacci retracement, measured from $0.00000459 to $0.00000223, at $0.00000279, acting as the last line of defense. A decisive close below this level could test the Fibonacci anchor at $0.00000233.
Momentum indicators back this weak tone, with the Directional Moving Index (DMI) showing the positive DI line holding above the negative DI line while the ADX line descends to 18. Taken together, the indicator reflects that bullish momentum is losing strength.
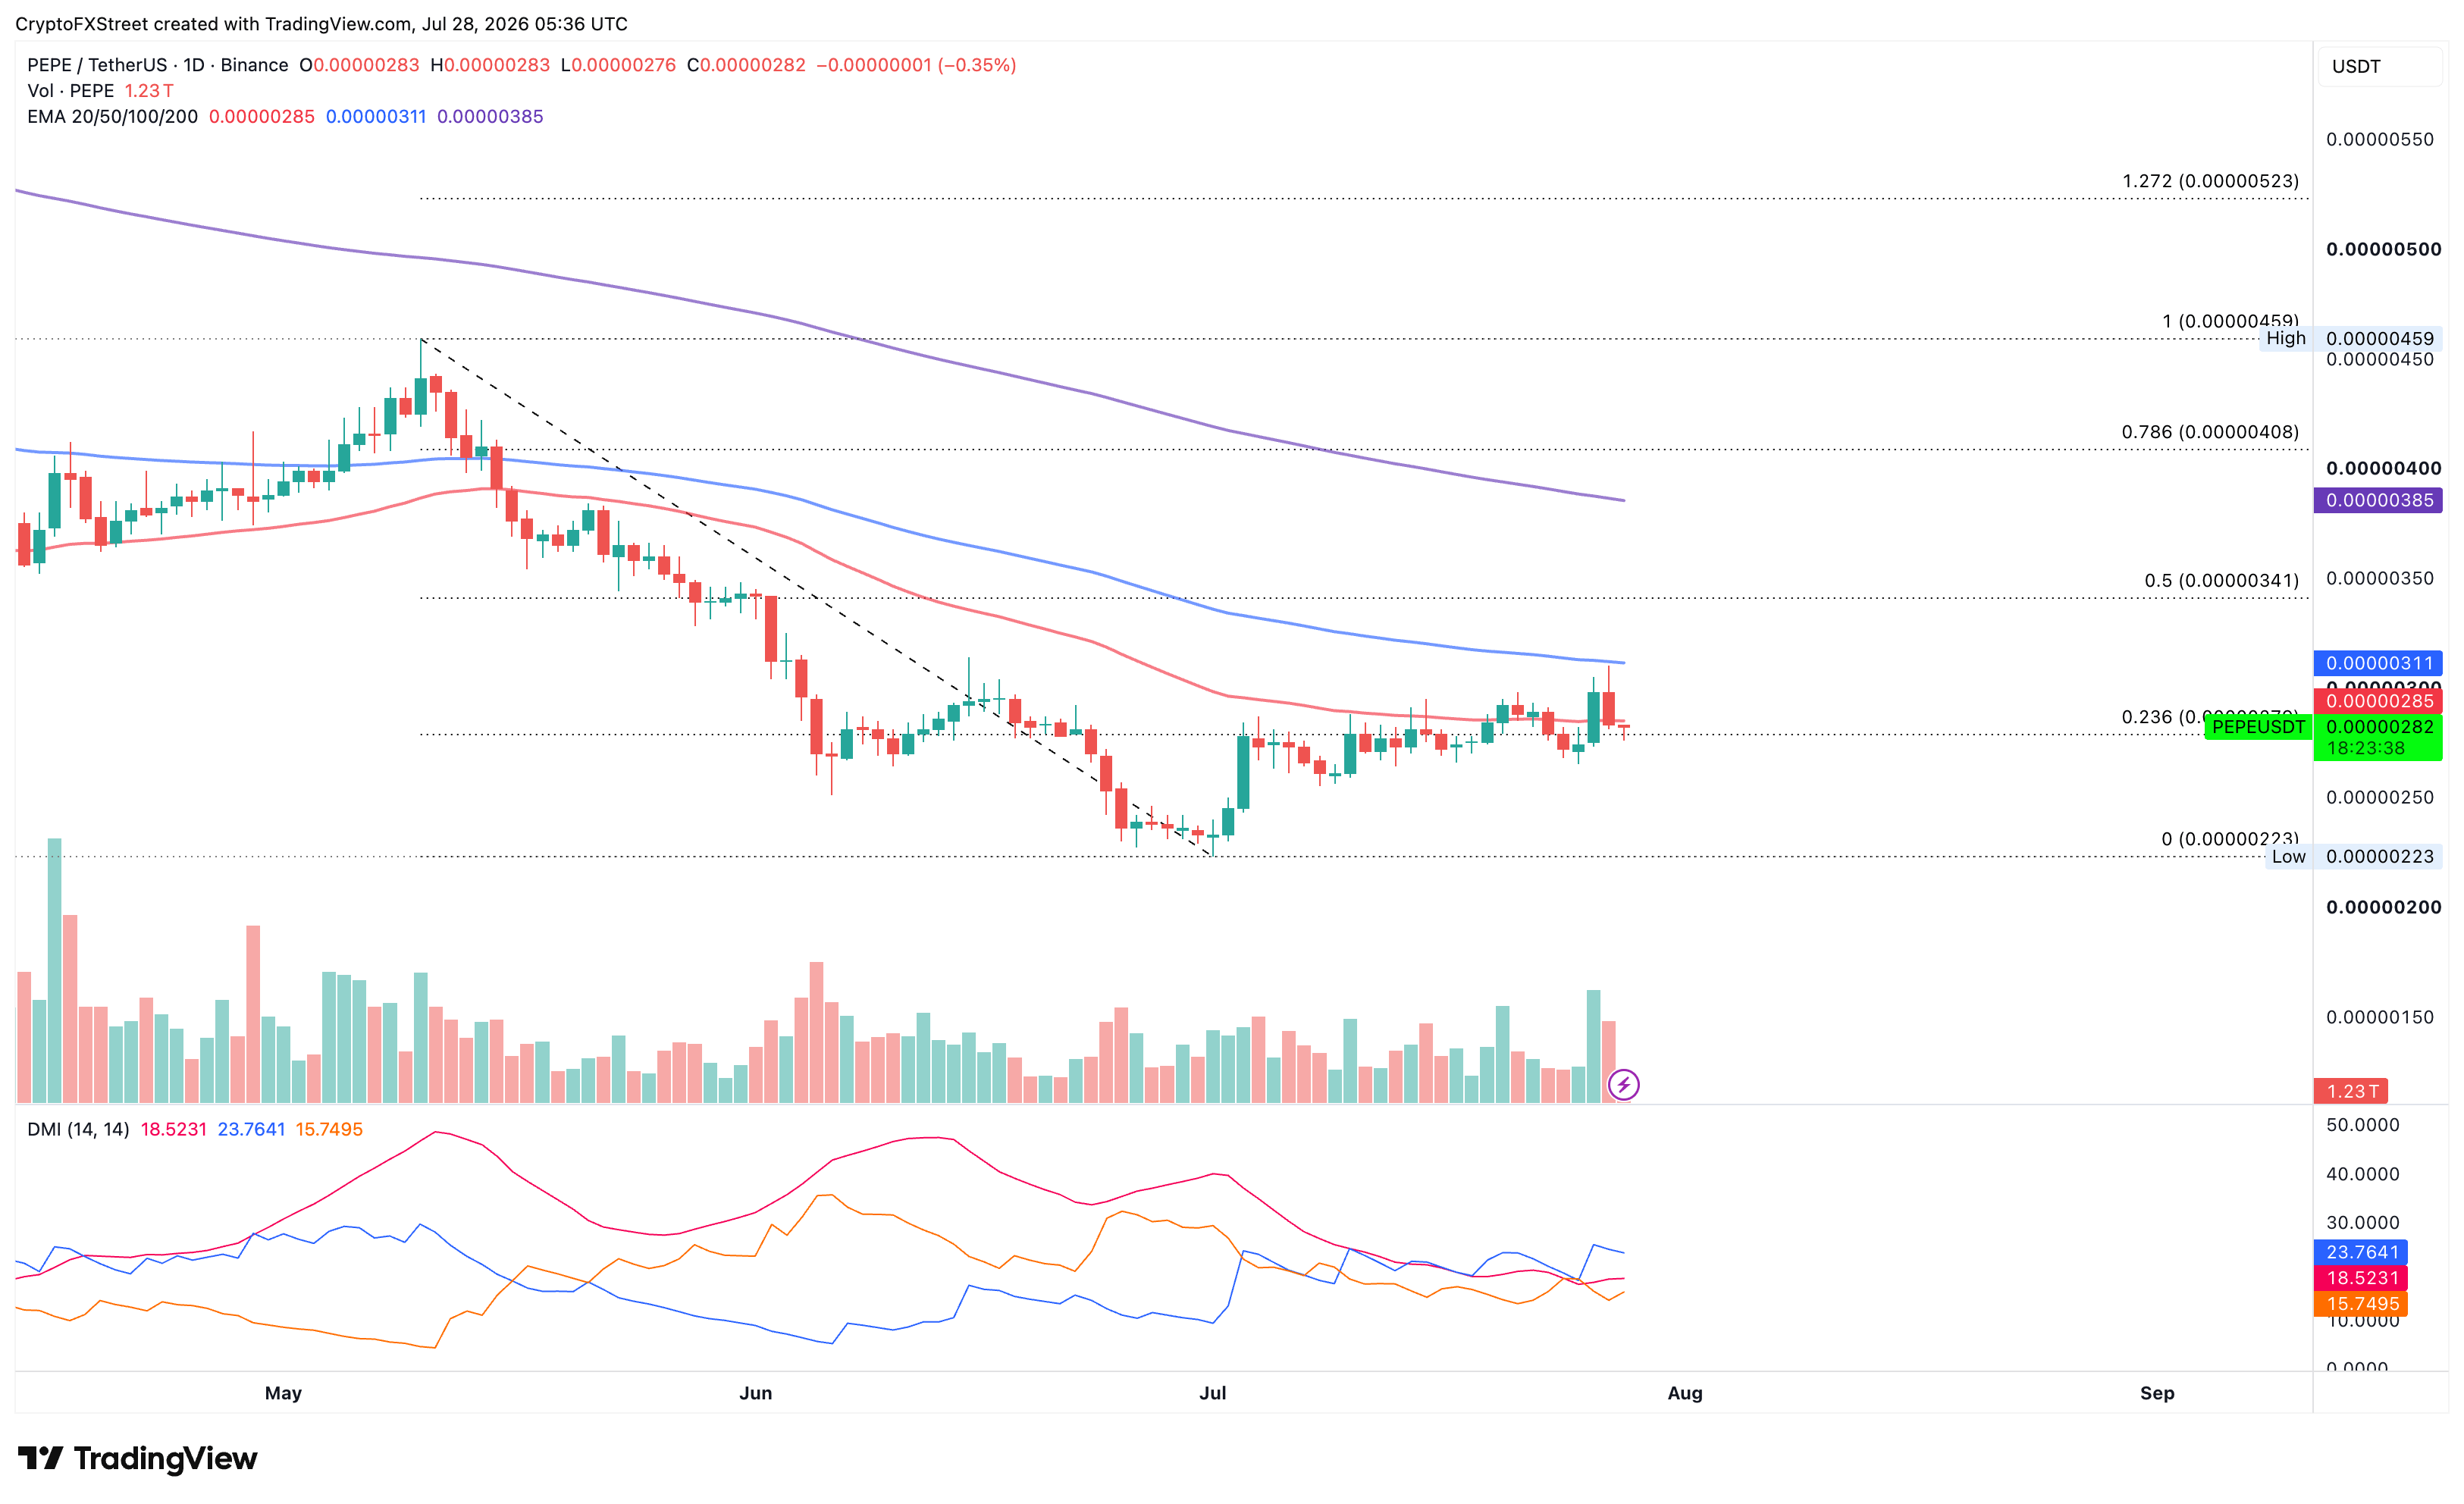
Looking up, the 50-day and 100-day EMAs at $0.00000285 and $0.00000311, respectively, act as immediate resistance levels, followed by the 50% retracement level at $0.00000341.
(The technical analysis of this story was written with the help of an AI tool. Know more.)
Recommended Articles


