

Cryptocurrencies Slump as Senate Delays CLARITY Act; Bitcoin Drops Below $65,000

Source Tradingkey

TradingKey - The CLARITY Act combined with rising pressure for a Federal Reserve rate hike triggered a collective plunge in cryptocurrencies.

On July 28, the cryptocurrency market experienced a collective plunge, with Bitcoin ( BTC) falling nearly 3% and losing the $65,000 threshold; Ethereum ( ETH) slumped nearly 4%, falling below $1,900; Binance Coin ( BNB) remained relatively resilient, falling by around 1%; other major coins all experienced varying degrees of decline.
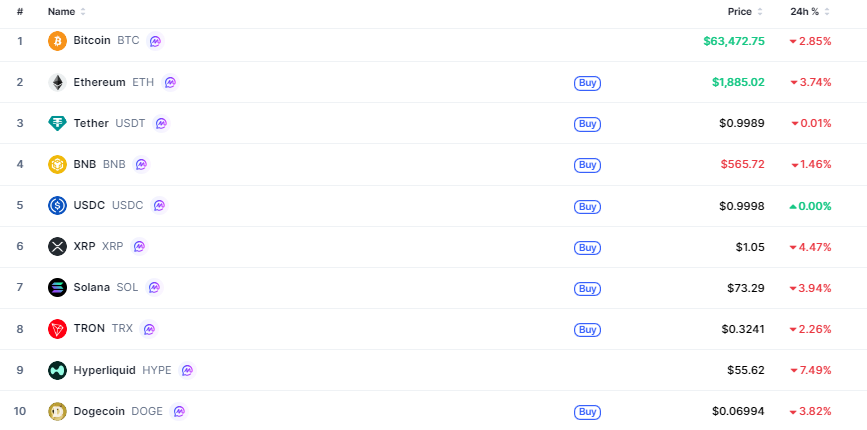
Crypto-marketcap-top10-8c98c09878964c76b01fe84bb7df7987Performance of the top 10 cryptocurrencies by market capitalization, Source: CoinMarketCap

On the news front, the highly anticipated CLARITY Act may be delayed. According to a CoinDesk report on July 28, under the schedule set by Majority Leader John Thune, the U.S. Senate will prioritize a sanctions bill against Russia and is unlikely to advance the CLARITY Act before then. John Thune explicitly stated that the CLARITY Act may not be passed before the summer recess (mid-July to late September), and the crypto industry currently views August 7 as an important window for the bill.

The delay of the bill instantly shattered the market's expectations for an "accelerated implementation of regulatory dividends," triggering profit-taking and safe-haven sell-offs by institutional funds and retail longs. In addition, the Federal Reserve (Fed) will hold its FOMC interest rate decision meeting from July 28 to 29, and market anxiety over the direction of monetary policy has further triggered short-term corrections and plunges in the cryptocurrency market. According to CME data, the market's expected probability of a Fed rate hike in July has risen to 37.9% (up from 31.5% yesterday), while the probability of keeping current interest rates unchanged stands at 62.1%.

Disclaimer: For information purposes only. Past performance is not indicative of future results.
placeholder
Bitcoin Bears Take Control as $1.35 Billion Loss Wave Triggers ETF Outflowsitcoin has slipped into a bear market below $65,000, driven by $4.21 billion in ETF redemptions, worsening spot demand, and a massive surge in long-term holder capitulation.
Author  Mitrade Team
6 Month 04 Day Thu
itcoin has slipped into a bear market below $65,000, driven by $4.21 billion in ETF redemptions, worsening spot demand, and a massive surge in long-term holder capitulation.
placeholder
XRP Price Prediction for July 2026: Can Buyers Finally Break the Downtrend?XRP (XRP) price trades near $1.05, caught between a year-long downtrend and a sudden burst of buying.July has historically rewarded XRP holders. This year the month arrives with on-chain accumulation
Author  Beincrypto
6 Month 30 Day Tue
XRP (XRP) price trades near $1.05, caught between a year-long downtrend and a sudden burst of buying.July has historically rewarded XRP holders. This year the month arrives with on-chain accumulation
placeholder
Gold Price Forecast: Iran Denies Trump Negotiation Plan, Gold Price May Fall to $3,500TradingKey - As of today's (July 1st) Asian morning session, gold ( XAUUSD) prices maintained a weak intraday decline. After stabilizing above $4,000 at yesterday's close, the gold price broke below $
Author  TradingKey
7 Month 01 Day Wed
TradingKey - As of today's (July 1st) Asian morning session, gold ( XAUUSD) prices maintained a weak intraday decline. After stabilizing above $4,000 at yesterday's close, the gold price broke below $
placeholder
What to Expect From Ethereum (ETH) in July 2026Ethereum (ETH) enters July 2026 trading near $1,570, close to multi-month lows, after recording its first run of three consecutive red quarterly candles in its history.On-chain data and price charts n
Author  Beincrypto
7 Month 01 Day Wed
Ethereum (ETH) enters July 2026 trading near $1,570, close to multi-month lows, after recording its first run of three consecutive red quarterly candles in its history.On-chain data and price charts n
placeholder
Intel Price Forecast: Nvidia Picked Xeon 6, Invested $5B, Yet Analysts Still Trail INTCIntel Corporation (NASDAQ: INTC) sits at $140.05, holding firm on the ascending trendline within the 2H timeframe. The RSI indicator is currently reading 55.21, positioning it as neutral-
Author  TradingKey
7 Month 02 Day Thu
Intel Corporation (NASDAQ: INTC) sits at $140.05, holding firm on the ascending trendline within the 2H timeframe. The RSI indicator is currently reading 55.21, positioning it as neutral-
goTop
quote