


Gold struggles for direction ahead of Federal Reserve policy verdict
- Gold holds above $4,000 as traders await the Federal Reserve's interest rate decision.
- Renewed attacks in the Middle East lift Oil prices, keeping inflation concerns in focus.
- The technical picture remains bearish, with XAU/USD holding below its 21-day, 50-day and 100-day SMAs.
Gold (XAU/USD) consolidates above $4,000 on Wednesday, as price action remains choppy amid growing caution ahead of the Federal Reserve’s (Fed) monetary policy announcement, while the war in the Middle East intensifies again after a brief lull.
Iran’s Islamic Revolutionary Guard Corps (IRGC) launched missiles at a US base in Jordan. Separately, the US Central Command (CENTCOM) said it carried out precision strikes in coordination with Saudi Arabia against Iran-backed groups in Iraq planning attacks on US forces and Saudi Oil facilities.
Oil prices reversed course following the latest attacks, snapping a three-day sell-off. West Texas Intermediate (WTI) trades around $81.00, up more than 3.50% on the day.
Meanwhile, the US Dollar Index (DXY), which tracks the Greenback’s value against a basket of six major currencies, trades around 101.40, supported by Fed rate-hike expectations and tensions in the Middle East.
The Fed will announce its interest-rate decision at 18:00 GMT, followed by Chair Kevin Warsh’s press conference at 18:30 GMT.
The US central bank is widely expected to leave interest rates unchanged within the 3.50%-3.75% range. However, a rate hike cannot be ruled out amid heightened energy-driven inflation risks.
According to the CME FedWatch Tool, traders price in around a 31% chance of a 25-basis-point increase (bps). Higher borrowing costs typically reduce demand for Gold by increasing the appeal of interest-bearing assets.
Even if the Fed keeps rates unchanged, Gold may struggle to stage a recovery as policymakers are expected to maintain a hawkish stance while assessing the inflationary impact of elevated Oil prices. If the Fed signals that a rate hike could come in the next few months, XAU/USD could face renewed selling pressure.
Technical analysis: sellers retain control below key daily SMAs
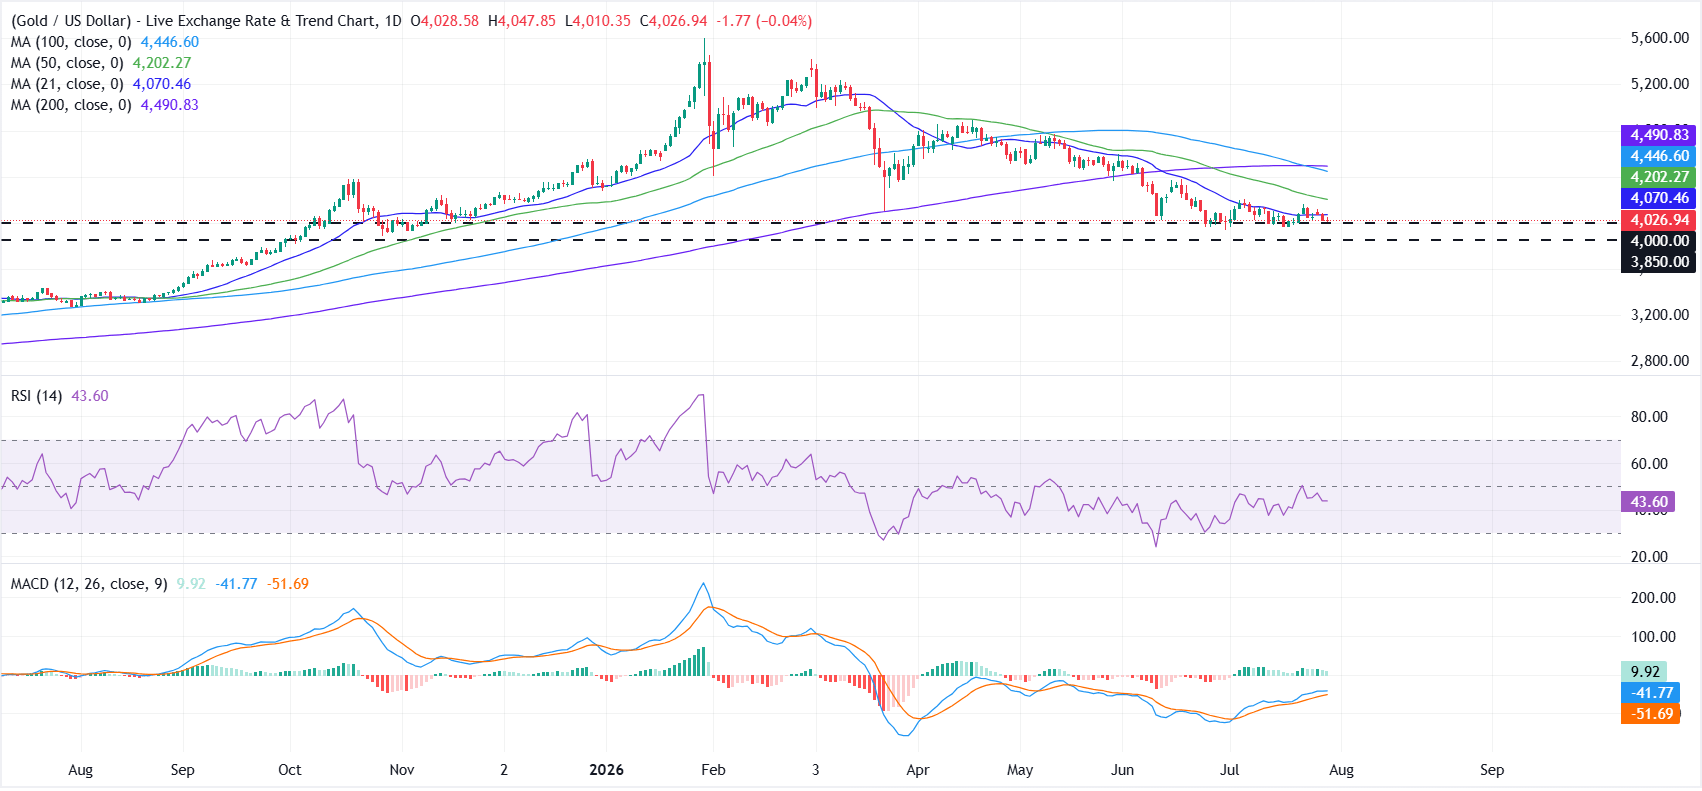
From a technical perspective, XAU/USD maintains a bearish bias as it trades below the 21-day, 50-day, 100-day and 200-day Simple Moving Averages (SMAs).
The Relative Strength Index (RSI) on the daily chart is near 44 and remains below the neutral 50 level, while the shrinking green bars on the Moving Average Convergence Divergence (MACD) histogram suggest that sellers retain control.
On the topside, initial resistance is seen at the 21-day SMA around $4,070, followed by the 50-day SMA near $4,202. Further up, the 100-day and 200-day SMAs at $4,446 and $4,490, respectively, form a key resistance zone.
On the downside, immediate support is located at the psychological $4,000 mark, with a break below this level exposing the next structural support around $3,850.
(The technical analysis of this story was written with the help of an AI tool. Know more.)
Fed FAQs
Monetary policy in the US is shaped by the Federal Reserve (Fed). The Fed has two mandates: to achieve price stability and foster full employment. Its primary tool to achieve these goals is by adjusting interest rates. When prices are rising too quickly and inflation is above the Fed’s 2% target, it raises interest rates, increasing borrowing costs throughout the economy. This results in a stronger US Dollar (USD) as it makes the US a more attractive place for international investors to park their money. When inflation falls below 2% or the Unemployment Rate is too high, the Fed may lower interest rates to encourage borrowing, which weighs on the Greenback.
The Federal Reserve (Fed) holds eight policy meetings a year, where the Federal Open Market Committee (FOMC) assesses economic conditions and makes monetary policy decisions. The FOMC is attended by twelve Fed officials – the seven members of the Board of Governors, the president of the Federal Reserve Bank of New York, and four of the remaining eleven regional Reserve Bank presidents, who serve one-year terms on a rotating basis.
In extreme situations, the Federal Reserve may resort to a policy named Quantitative Easing (QE). QE is the process by which the Fed substantially increases the flow of credit in a stuck financial system. It is a non-standard policy measure used during crises or when inflation is extremely low. It was the Fed’s weapon of choice during the Great Financial Crisis in 2008. It involves the Fed printing more Dollars and using them to buy high grade bonds from financial institutions. QE usually weakens the US Dollar.
Quantitative tightening (QT) is the reverse process of QE, whereby the Federal Reserve stops buying bonds from financial institutions and does not reinvest the principal from the bonds it holds maturing, to purchase new bonds. It is usually positive for the value of the US Dollar.
Recommended Articles


