


British Pound consolidates against Japanese Yen ahead of central bank decisions
- GBP/JPY consolidates after reaching its highest level since December 2007 earlier this month.
- Traders avoid aggressive positions ahead of the BoE and BoJ monetary policy announcements.
- The cross holds above its key daily moving averages, keeping the broader bullish structure intact.
GBP/JPY extends its subdued price action on Wednesday, forming a series of small-bodied candlesticks after briefly climbing above 219.00 earlier this month, its highest level since December 2007. At the time of writing, the cross trades around 217.50.
The loss of upside momentum reflects weakening sentiment toward the British Pound (GBP) rather than any meaningful recovery in the Japanese Yen (JPY). Initial optimism following the appointment of the United Kingdom’s new prime minister has faded, with fiscal concerns returning as a near-term headwind for Sterling.
However, the downside for GBP/JPY appears limited, as the Yen remains broadly weak due to Japan’s wide interest-rate gap with other major economies. The latest energy shock also weighs on the currency, given the country’s heavy reliance on imported Oil.
Meanwhile, traders are also avoiding aggressive directional positions, with the Bank of England (BoE) and Bank of Japan (BoJ) monetary policy announcements among the key risk events on tap later this week.
Both central banks are widely expected to leave interest rates unchanged, shifting attention to their policy statements and officials’ remarks for clues about the future path of interest rates and how policymakers intend to respond to energy-driven inflation risks.
Technical Analysis
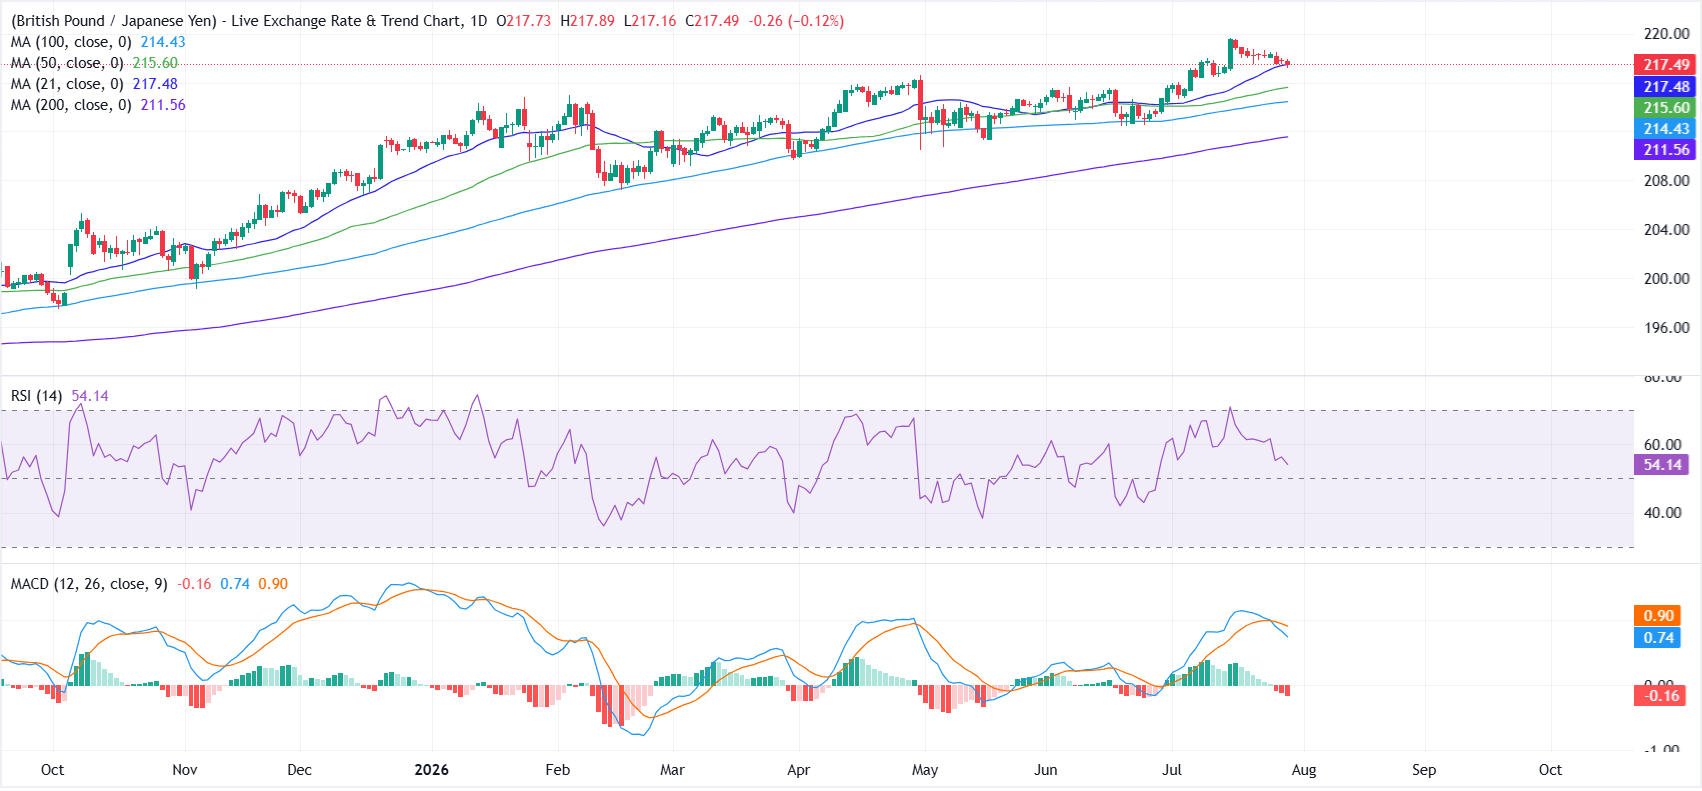
On the daily chart, GBP/JPY holds a constructive near-term bias as it sits marginally above the 21-day Simple Moving Average (SMA) at 217.48 and well above the 50-, 100- and 200-day SMAs.
Momentum is mixed, with the Relative Strength Index (RSI) around 54 after easing from overbought territory, while the Moving Average Convergence Divergence (MACD) indicator has slipped just below zero, suggesting that upside momentum is fading rather than collapsing.
On the upside, initial resistance is seen at 218.50, followed by the yearly high of 219.61. On the downside, initial support emerges at the 21-day SMA near 217.48, with the 50-day SMA at 215.60 and the 100-day SMA at 214.43 offering additional layers of demand if a deeper pullback develops.
A more decisive deterioration would expose the broader bullish structure around the 200-day SMA at 211.56, where buyers would be expected to defend the longer-term trend.
(The technical analysis of this story was written with the help of an AI tool. Know more.)
Economic Indicator
BoE Interest Rate Decision
The Bank of England (BoE) announces its interest rate decision at the end of its eight scheduled meetings per year. If the BoE is hawkish about the inflationary outlook of the economy and raises interest rates it is usually bullish for the Pound Sterling (GBP). Likewise, if the BoE adopts a dovish view on the UK economy and keeps interest rates unchanged, or cuts them, it is seen as bearish for GBP.
Read more.Next release: Thu Jul 30, 2026 11:00
Frequency: Irregular
Consensus: 3.75%
Previous: 3.75%
Source: Bank of England
Recommended Articles


