


Gold Price Forecast: Gold Under Pressure Below $4,200 as Market Awaits Fed Minutes
TradingKey - As of the Asian session on July 7, gold prices ( XAUUSD) fluctuated and weakened near $4,140. From a technical perspective, gold prices rebounded for four consecutive trading days and touched the resistance level of $4,200 yesterday, triggering short-term profit-taking by bulls, which subsequently caused gold prices to pull back for two consecutive trading days.
The dollar's rebound weighed on gold prices, but cooling expectations of Fed rate hikes limited the downside.
From a fundamental perspective, the core driver of the recent sustained rally in gold prices is the weaker-than-expected U.S. non-farm payrolls data released last week. The June non-farm payrolls report came in significantly below market expectations, reinforcing the view that the labor market is cooling and dampening expectations for further Federal Reserve rate hikes. For gold, a slowdown in employment typically signals cooling momentum in the U.S. economy, reducing the need for the Fed to maintain an aggressive stance. This limits the upside for U.S. Treasury yields and the dollar, thereby lowering the opportunity cost of holding non-yielding gold.
However, after a consecutive rally, the bullish impact of the payrolls data has been largely priced in by the market. Gold prices fluctuated and edged lower near $2,415 today, indicating that bulls have refrained from chasing higher prices. On one hand, the U.S. dollar index rebounded slightly after its previous decline, putting pressure on dollar-denominated gold. On the other hand, investors are awaiting the Federal Reserve meeting minutes scheduled for release on July 8, Eastern Time. Ahead of the minutes, short-term capital is more inclined to lock in some profits rather than pushing gold prices above the $2,420 level.
At the same time, the pullback in oil prices is indirectly improving the macroeconomic environment for gold. The crude oil market has recently faced pressure due to OPEC+ production increases and improved navigation through the Strait of Hormuz, with falling energy prices helping to ease market concerns over imported inflation. If oil prices stop driving up inflation, the likelihood of the Fed continuing to pursue aggressive policy measures will also decrease.
Gold Price Analysis: Facing Heavy Resistance at $4,200, Gold May See Short-Term Correction Toward $4,070
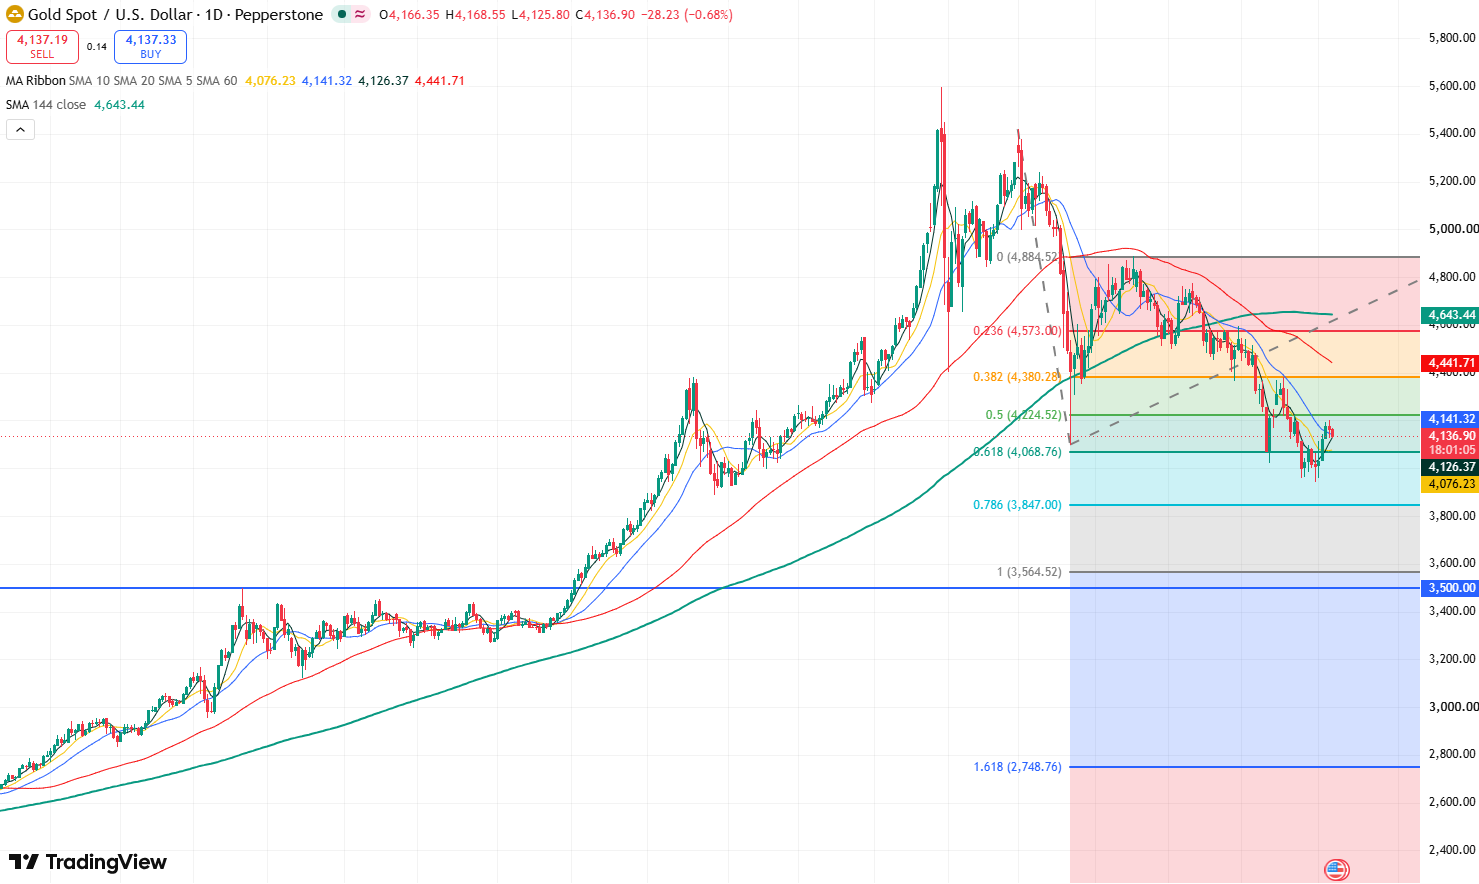
Gold Price Daily Chart, Source: TradingView
Looking at the daily chart of gold, the gold price has rebounded for four consecutive trading days, approaching the $4,200 resistance level yesterday. However, it closed lower on the day, forming a bearish candlestick, which indicates that bullish momentum has exhausted near this resistance level. Today, it has maintained a weak downward trend, further proving that bullish momentum has been significantly weakened, and the probability of a short-term downward correction in gold prices has increased substantially.
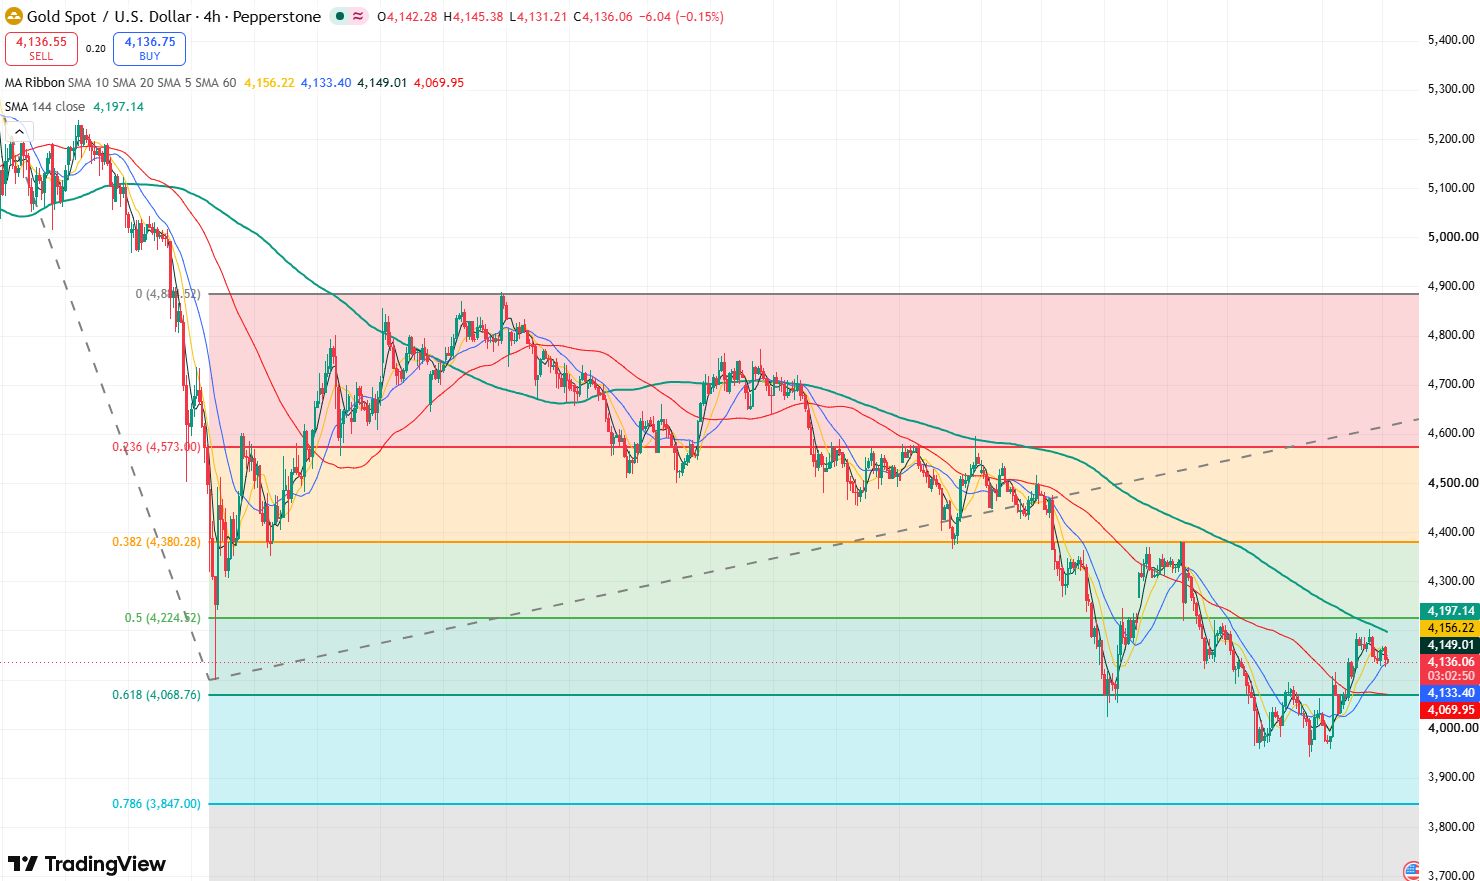
Gold Price 4-Hour Chart, Source: TradingView
Looking at the 4-hour chart of gold, the gold price recently rebounded to $4,200, which is also located below the SMA144, forming a resistance confluence. As the candlesticks have consecutively closed lower and weakened, market sentiment has gradually shifted to the bearish side.
At present, there is a high probability that the gold price will maintain its short-term correction trend. The primary downside target may be to test $4,100, and further down is the support level at $4,070, which is also near the SMA60, where the gold price is expected to halt its decline. If the gold price breaks below $4,070, it may further test the psychological support level of $4,000.
Recommended Articles


